Manage density, view, and sets of LiDAR

Written by Lane Cipriani
Updated at January 19th, 2024
Table of Contents
Point coloring
Once LiDAR data has been imported it may be shown in pure black and white. To color the point cloud data according to the classification in the LiDAR dataset, select that option from the Point coloring option on the View menu:
The Datasets tool
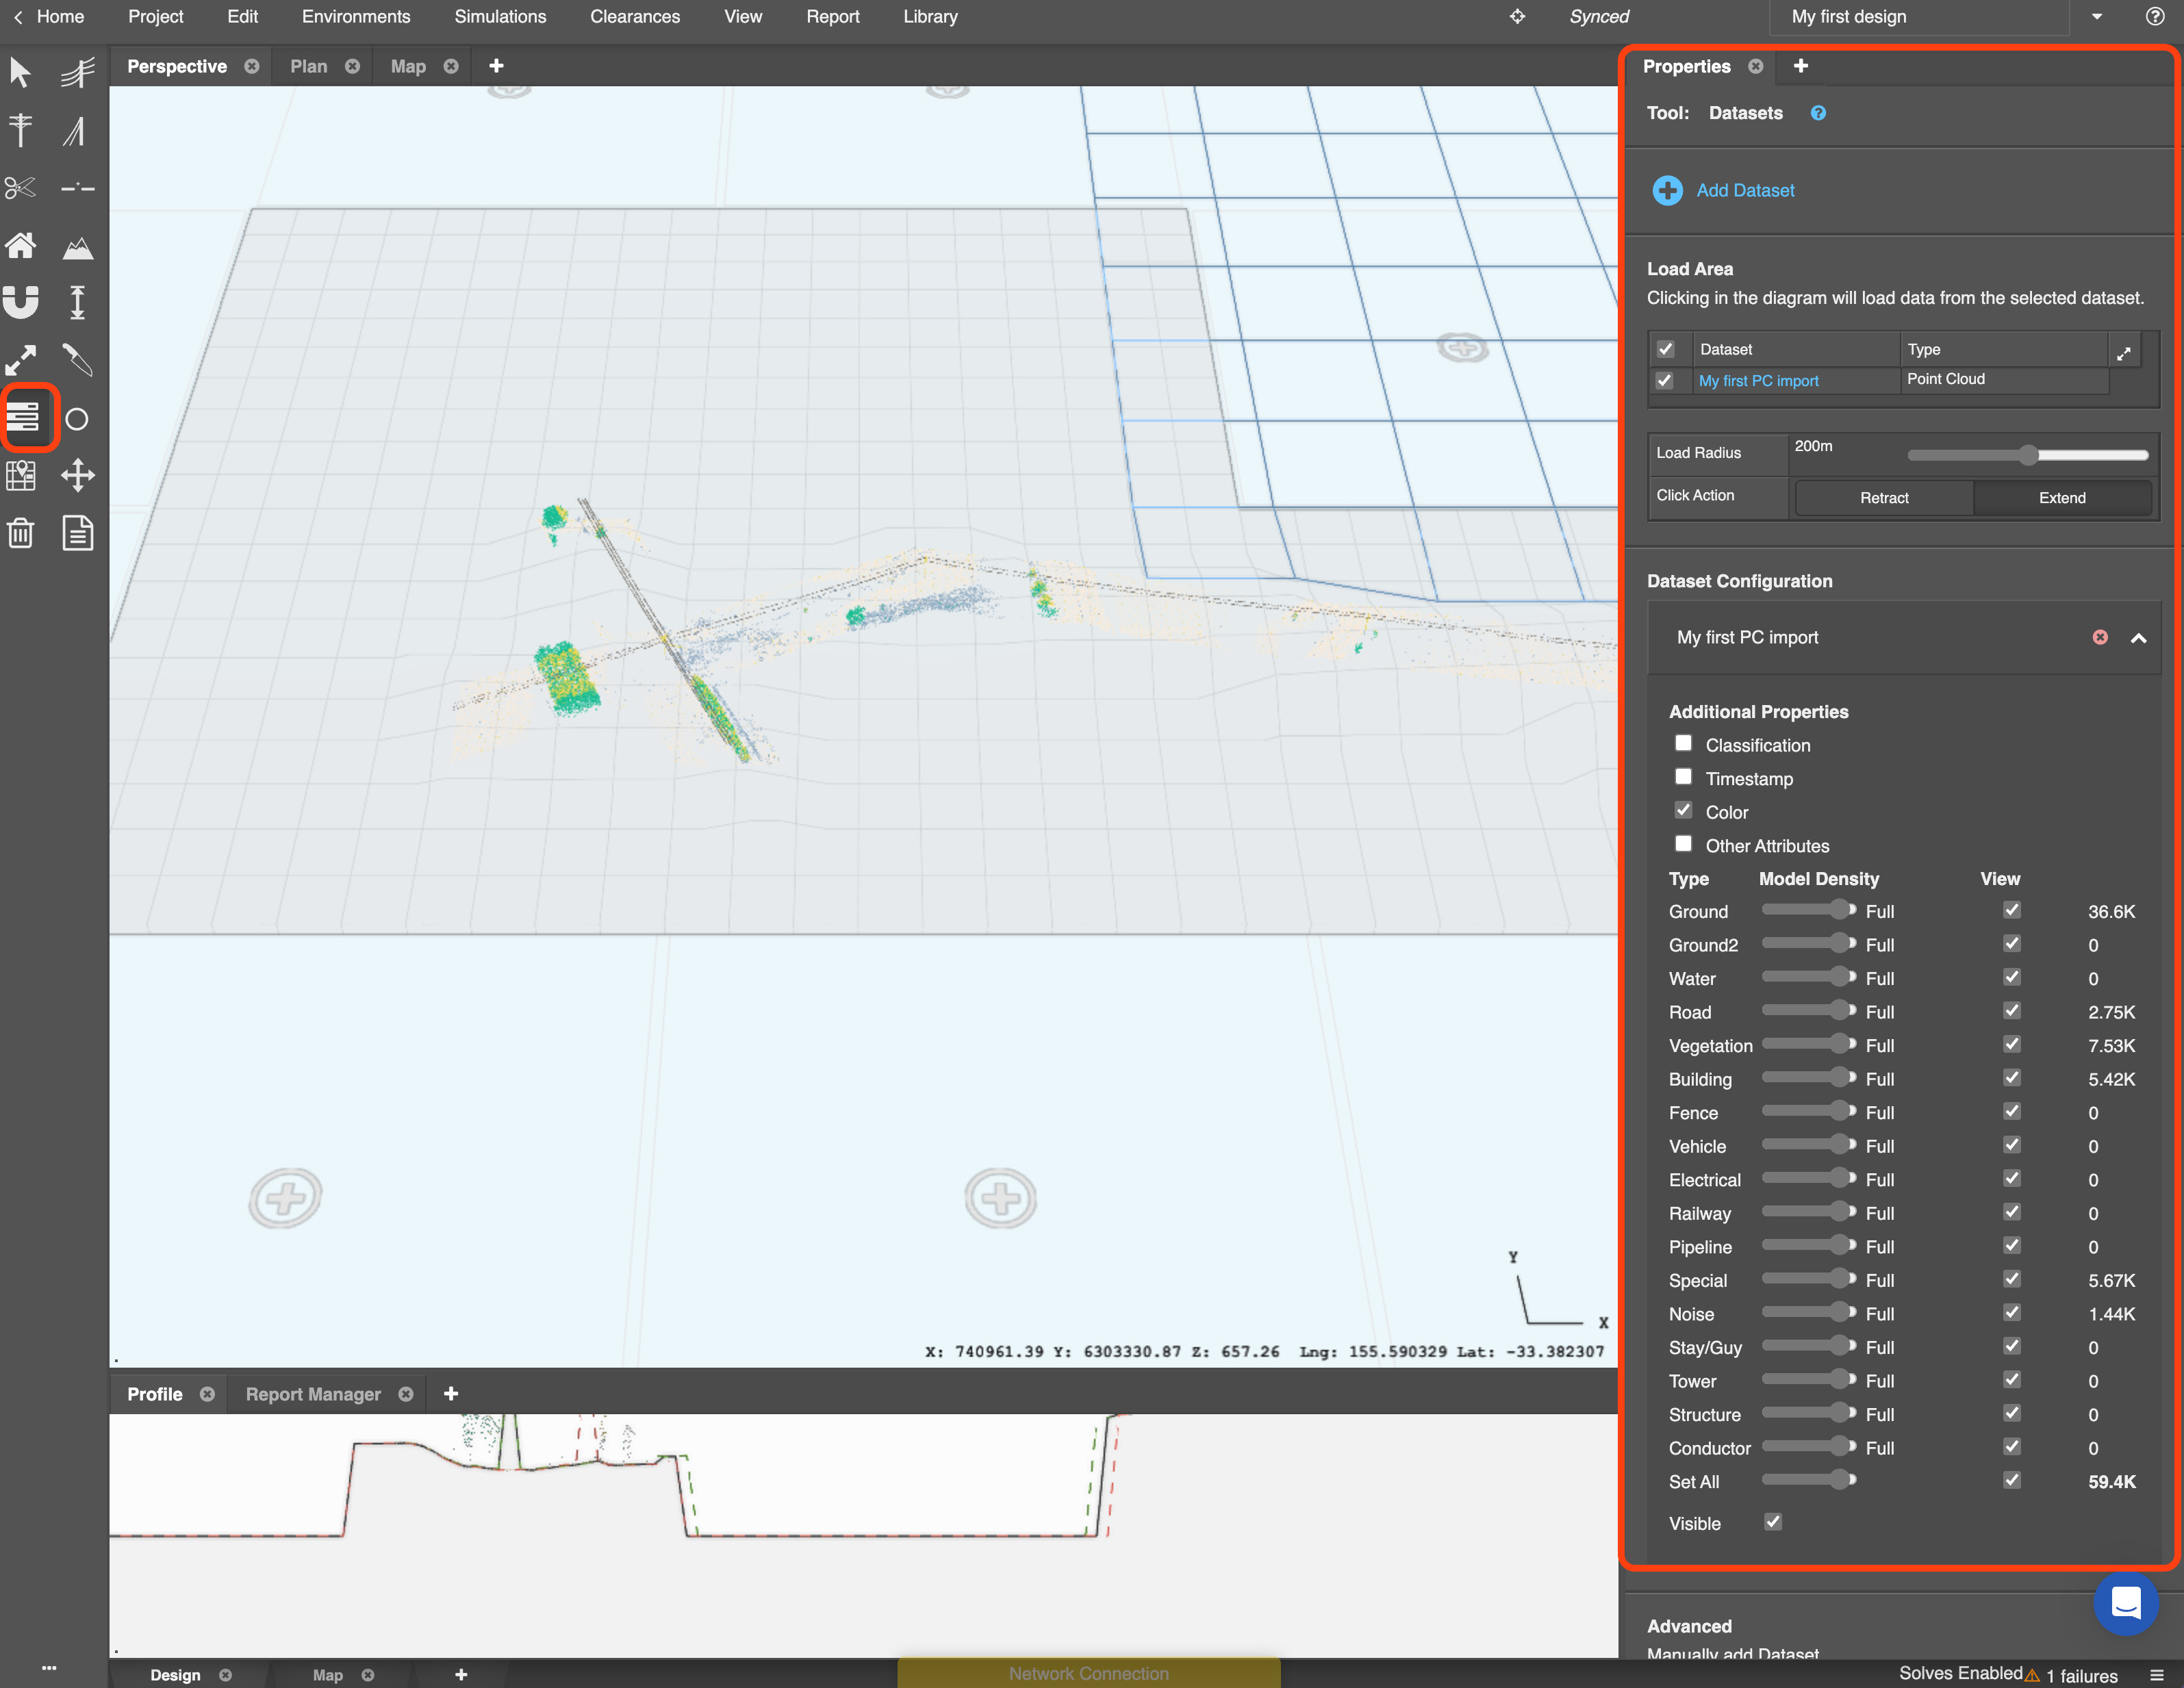
Use the Datasets tool on the toolbar to manage your imported datasets. Clicking it will display the Datasets properties and configuration panel in the sidebar:
Dataset configuration
The Dataset configuration section of the panel provides options to configure each dataset imported:
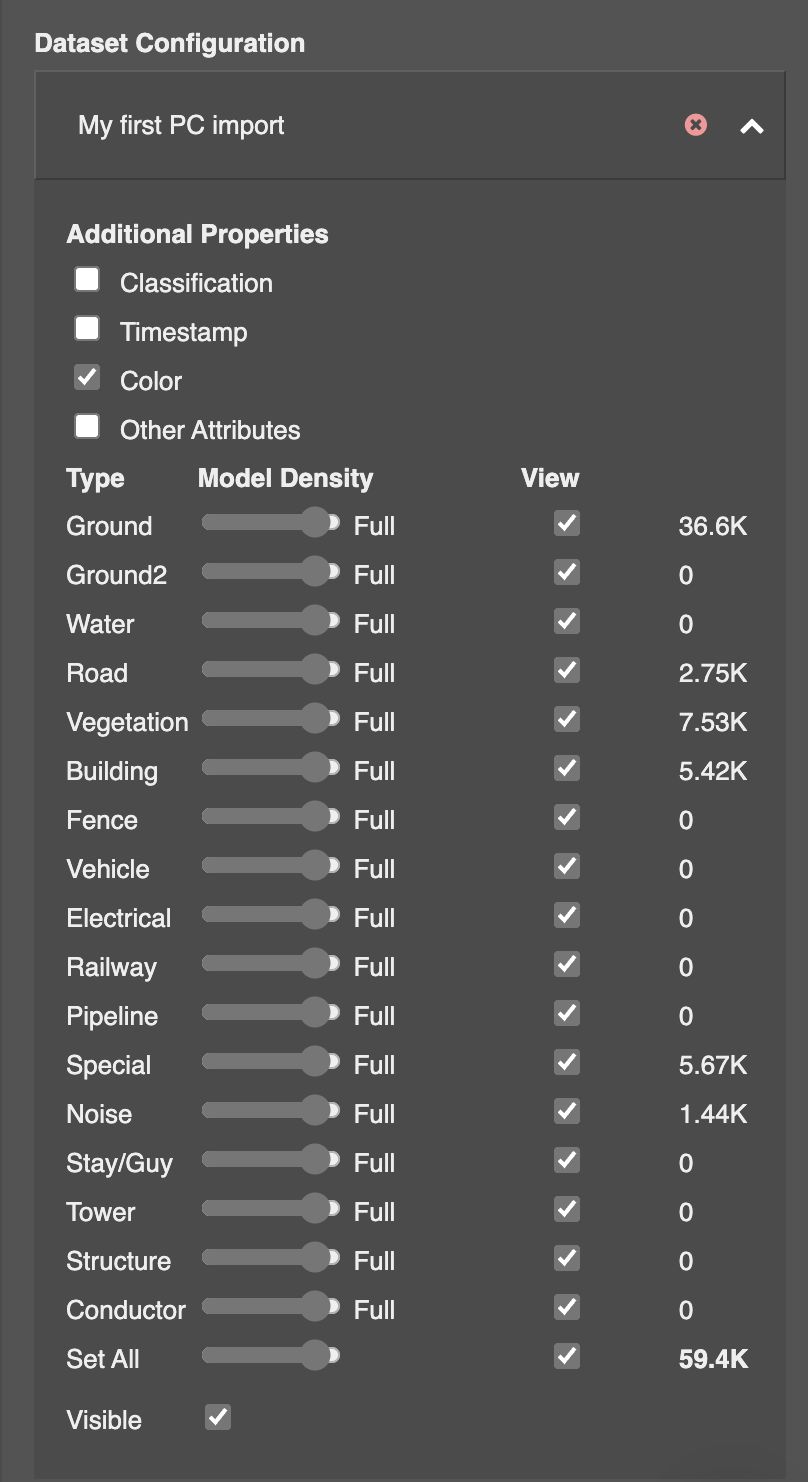
For each dataset you can define the:
-
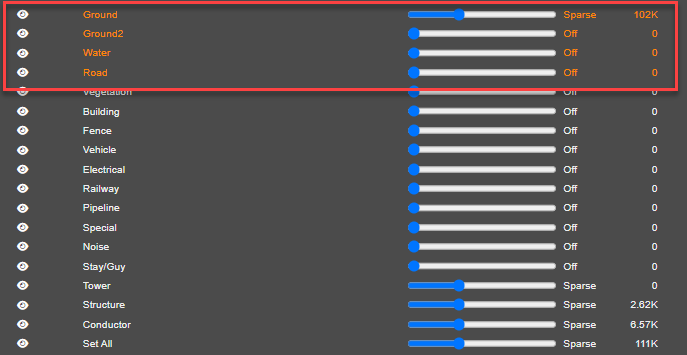
Model density: define the density of each classification: the number of points you want to render
- If your device is running slow, or some classifications are not needed, you can reduce their density - or turn them off completely by moving the slider to its lowest setting.
-
View: toggle a classification's View checkbox if you want to make the LiDAR point cloud viewable in the design or not
- It is typically good practice to turn the View off for Ground points to avoid making the display too busy, and to make it easier to see the map overlay.
Extend/retract dataset
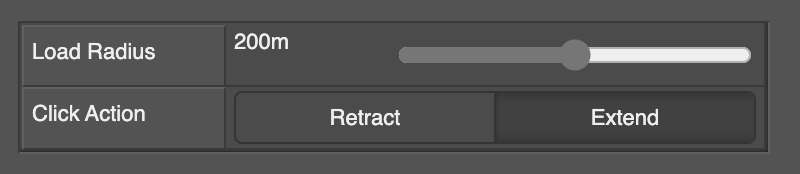
This feature on the panel allows you to specify a radius and select an area in your design to bring in the LiDAR data for an extended or smaller area. This is useful for working with larger LiDAR files:
Add dataset
Click the Add Dataset option to bring in another LIDAR file - such as an adjacent file that has already been uploaded:

Highlighted point cloud classes
If you have orange-colored highlighted point cloud classes displayed on the Layers panel under a Point Cloud dataset:
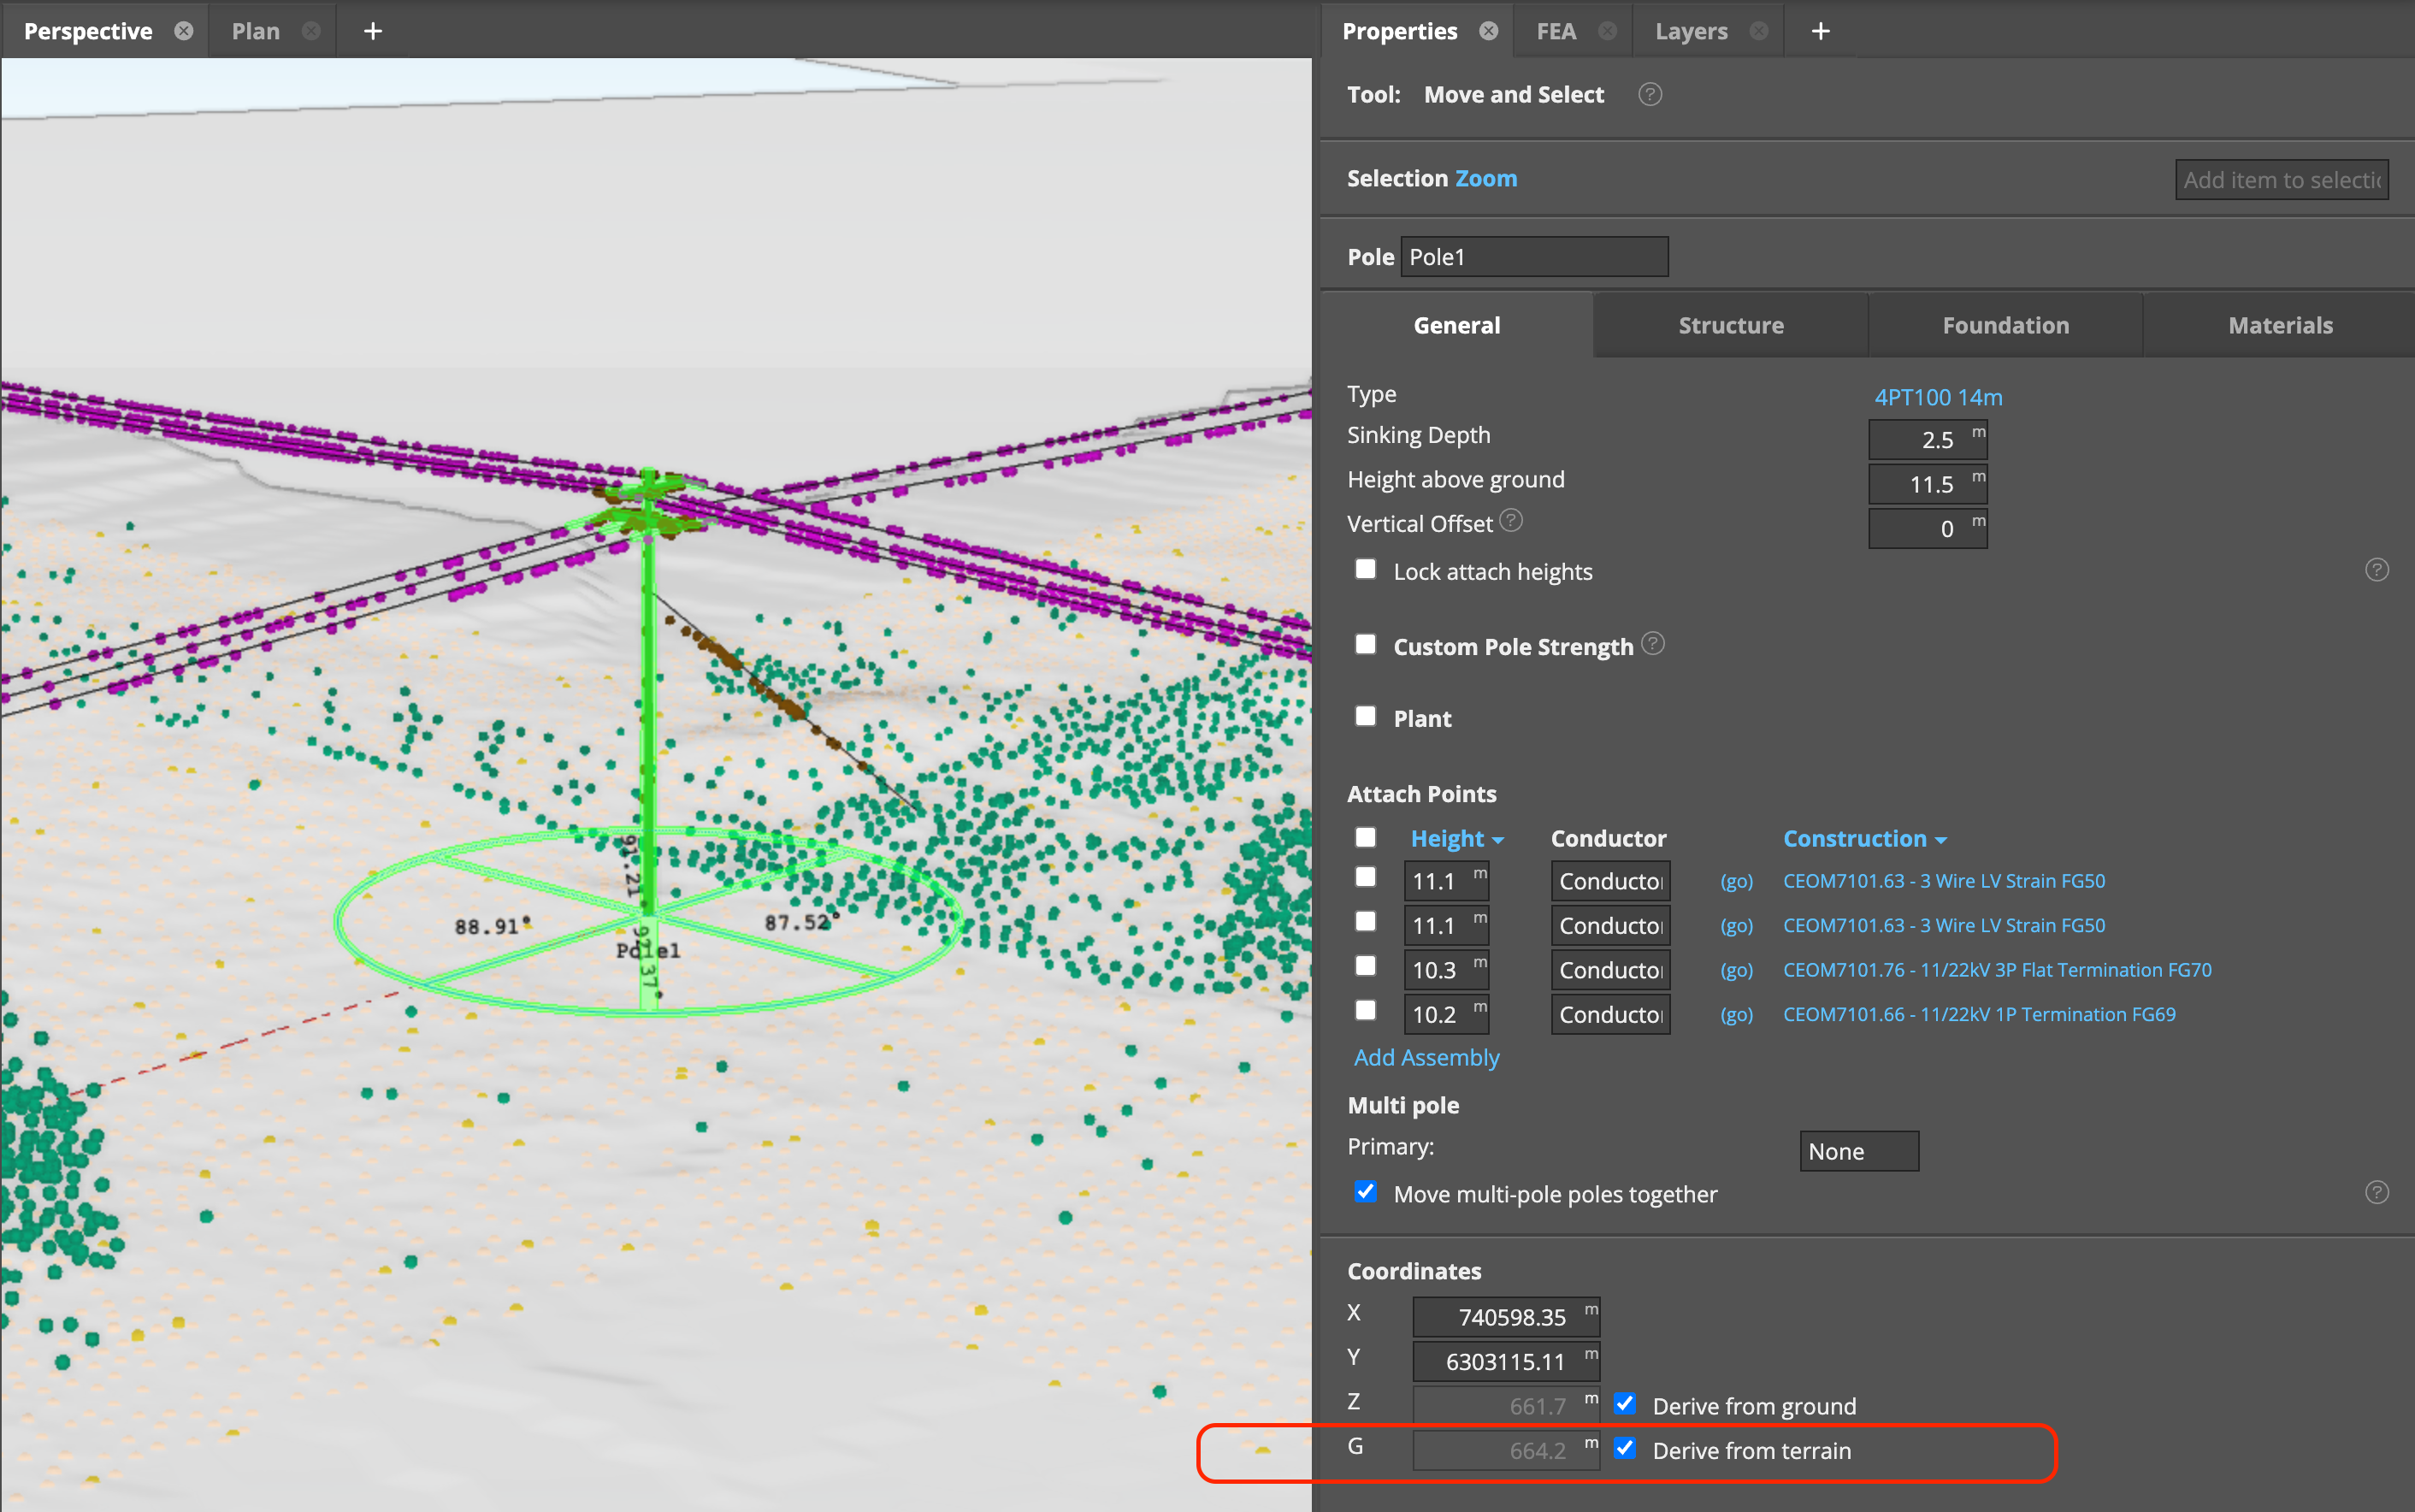
this indicates that your model contains poles whose Z coordinate automatically moves with the terrain. This message will appear below the list of classes on the Layers panel:
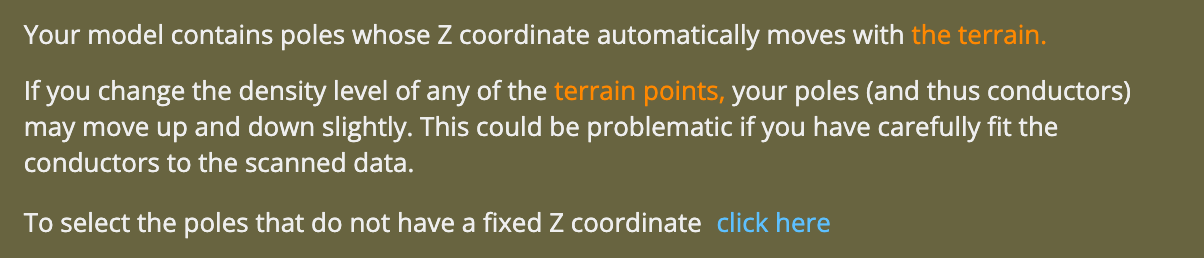
This will occur if any of the poles have the Derive from terrain option checked, found on the Pole Properties panel: