Step 2: Automatically classify LiDAR data
Learn how to automatically classify LiDAR data for analysis and visualization

Written by Jannet Xiao
Updated at September 6th, 2023
Table of Contents
If you do not see these features in your Neara projects and would like to explore Automatic LiDAR Classification, contact our Customer Success team using the Contact Us link above; or if logged into the Neara app choose Chat with support from the Help menu
In Step 1, we showed how Neara makes it easy to import LiDAR data from your computer – or directly from connected cloud storage – using the the Point Cloud Importer panel.
In this article, we show you how to rapidly and automatically classify LiDAR data using the Pipelines panel.
The Pipelines panel
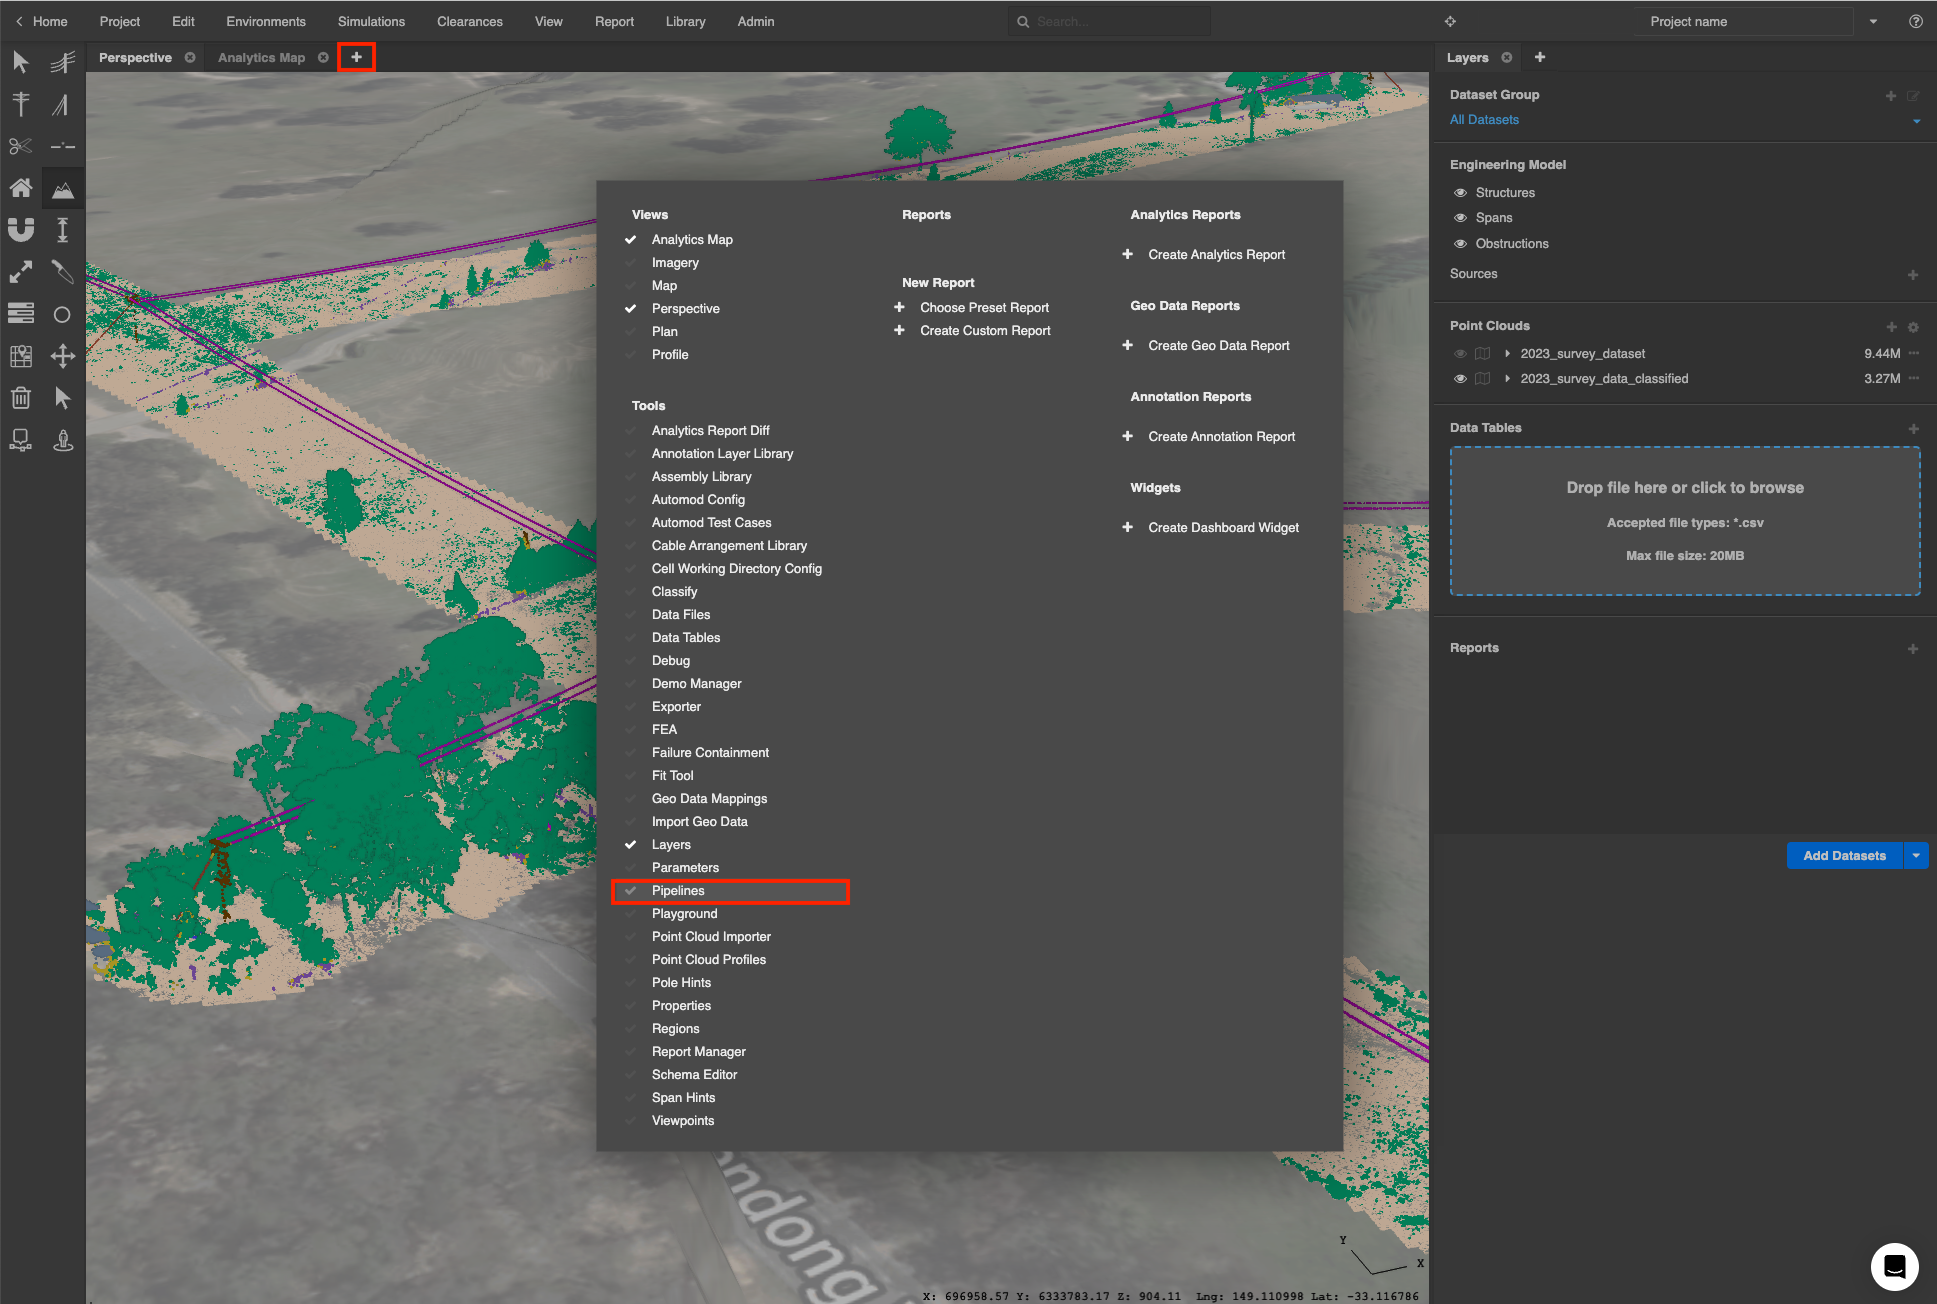
To open the Pipelines panel click the (+) button at the right hand end of the tabs in any section of the workspace, and select Pipelines under the Tools section in the popup:
The Pipelines panel will appear. If you have loaded pipelines previously, they will be listed on the left-hand side of the panel. You can adjust the width of the divider to accommodate long pipeline names:
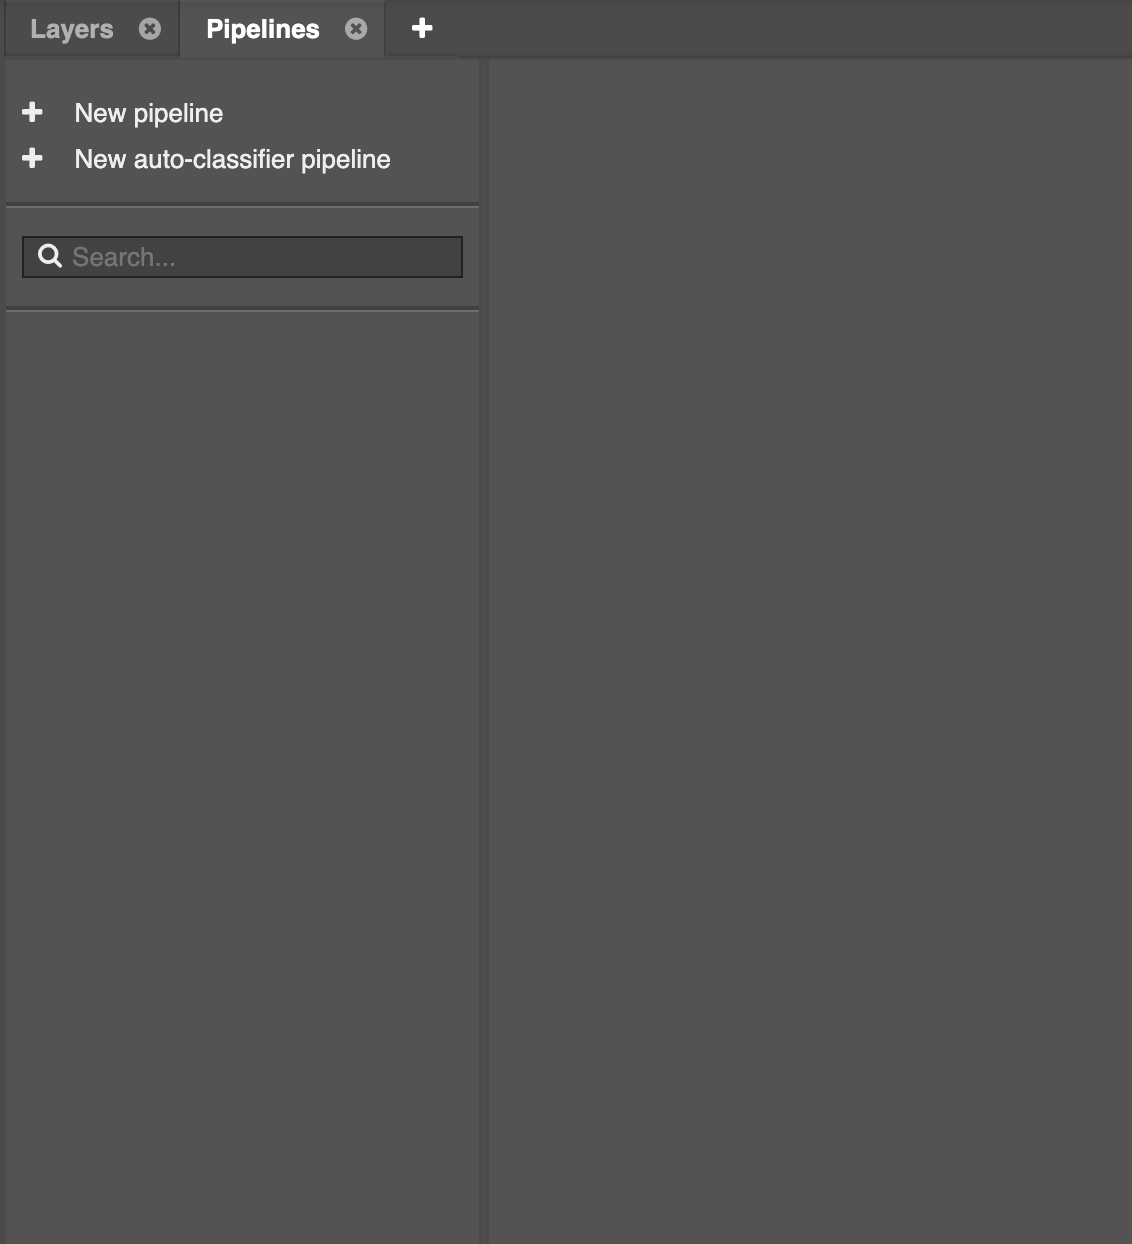
Add an auto-classifier pipeline
Click the + New auto-classifier pipeline option on the left side of the panel.
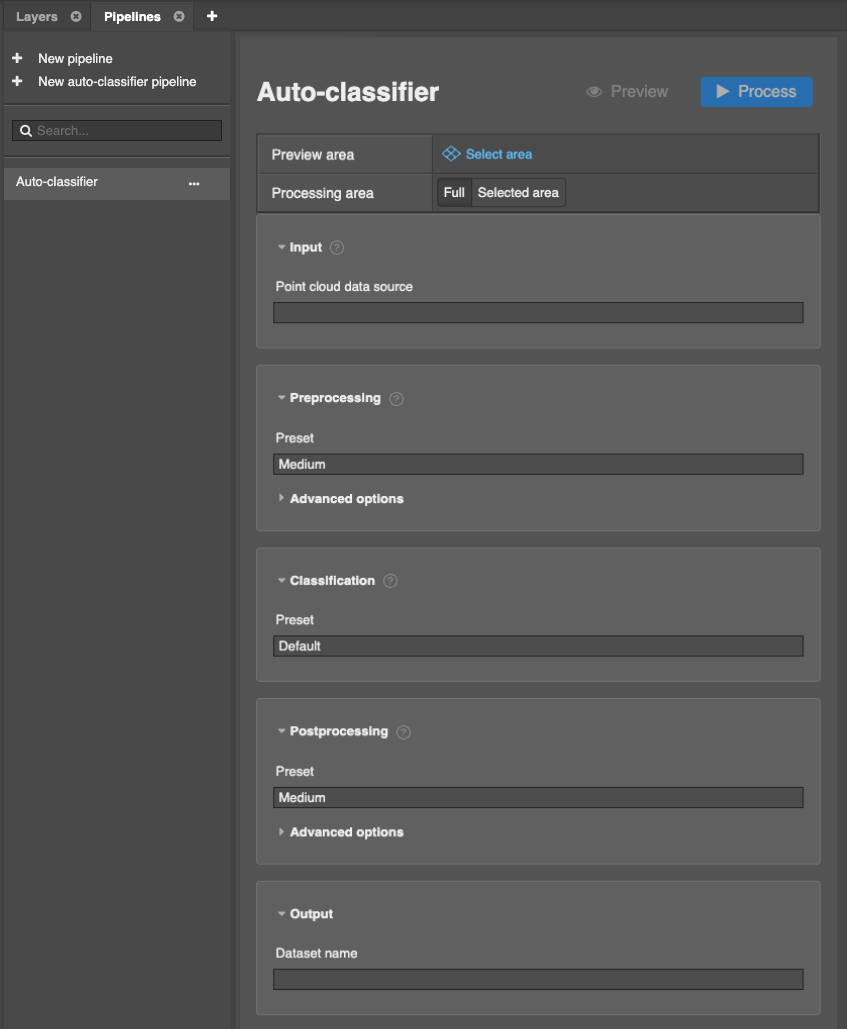
A new pipeline is optimised for automatic LiDAR classification is added to your list of pipelines with a default name. You can rename the pipeline by double-clicking its name:
The new pipeline's configuration and stages will appear on the right side of the panel:
Configure the pipeline
The auto-classifier pipeline consists of five stages:
- Input
- Pre-processing
- Classification
- Post-processing
- Output
Input
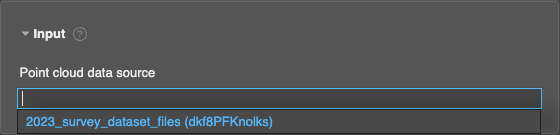
In the Input stage, select the dataset you want to classify. Click the Point cloud data source dropdown and select the new dataset you imported in Step 1:
Pre- and post- processing
The Preprocessing and Postprocessing stages provide options to normalize, denoise, and apply other filters to the data.
Understanding and tuning the Presets
To make it easy to get started, we have provided useful Presets for common pre- and post -processing requirements. They provide quick settings for common denoising tasks that you can use as-is, or further tune to your captured LiDAR data:
To understand how they work, consider this LiDAR capture that has been imported into Neara and displays some outlying points:
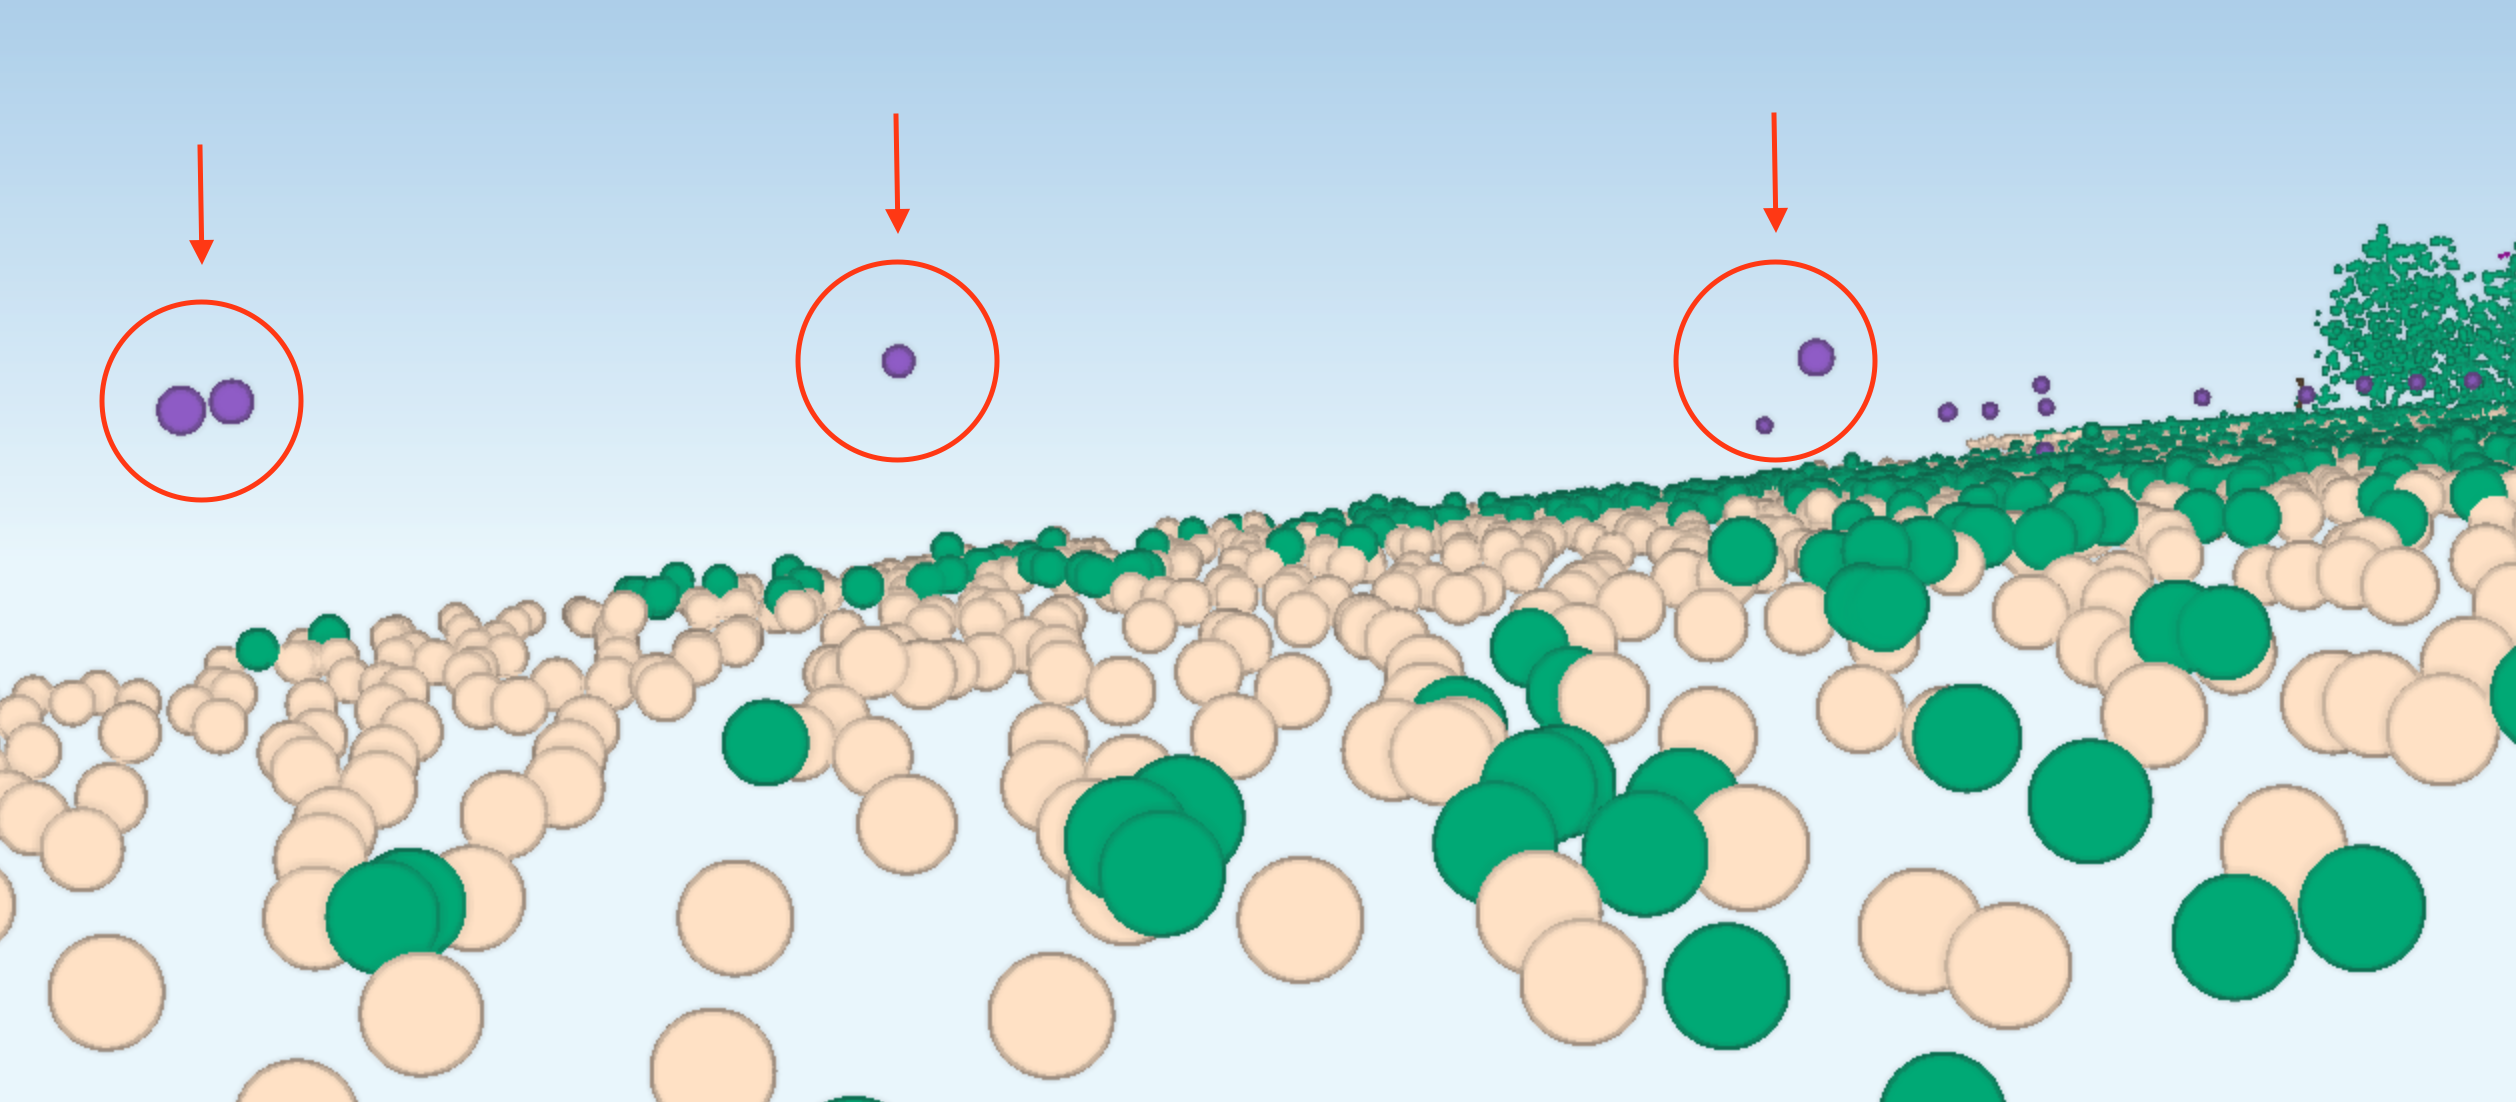
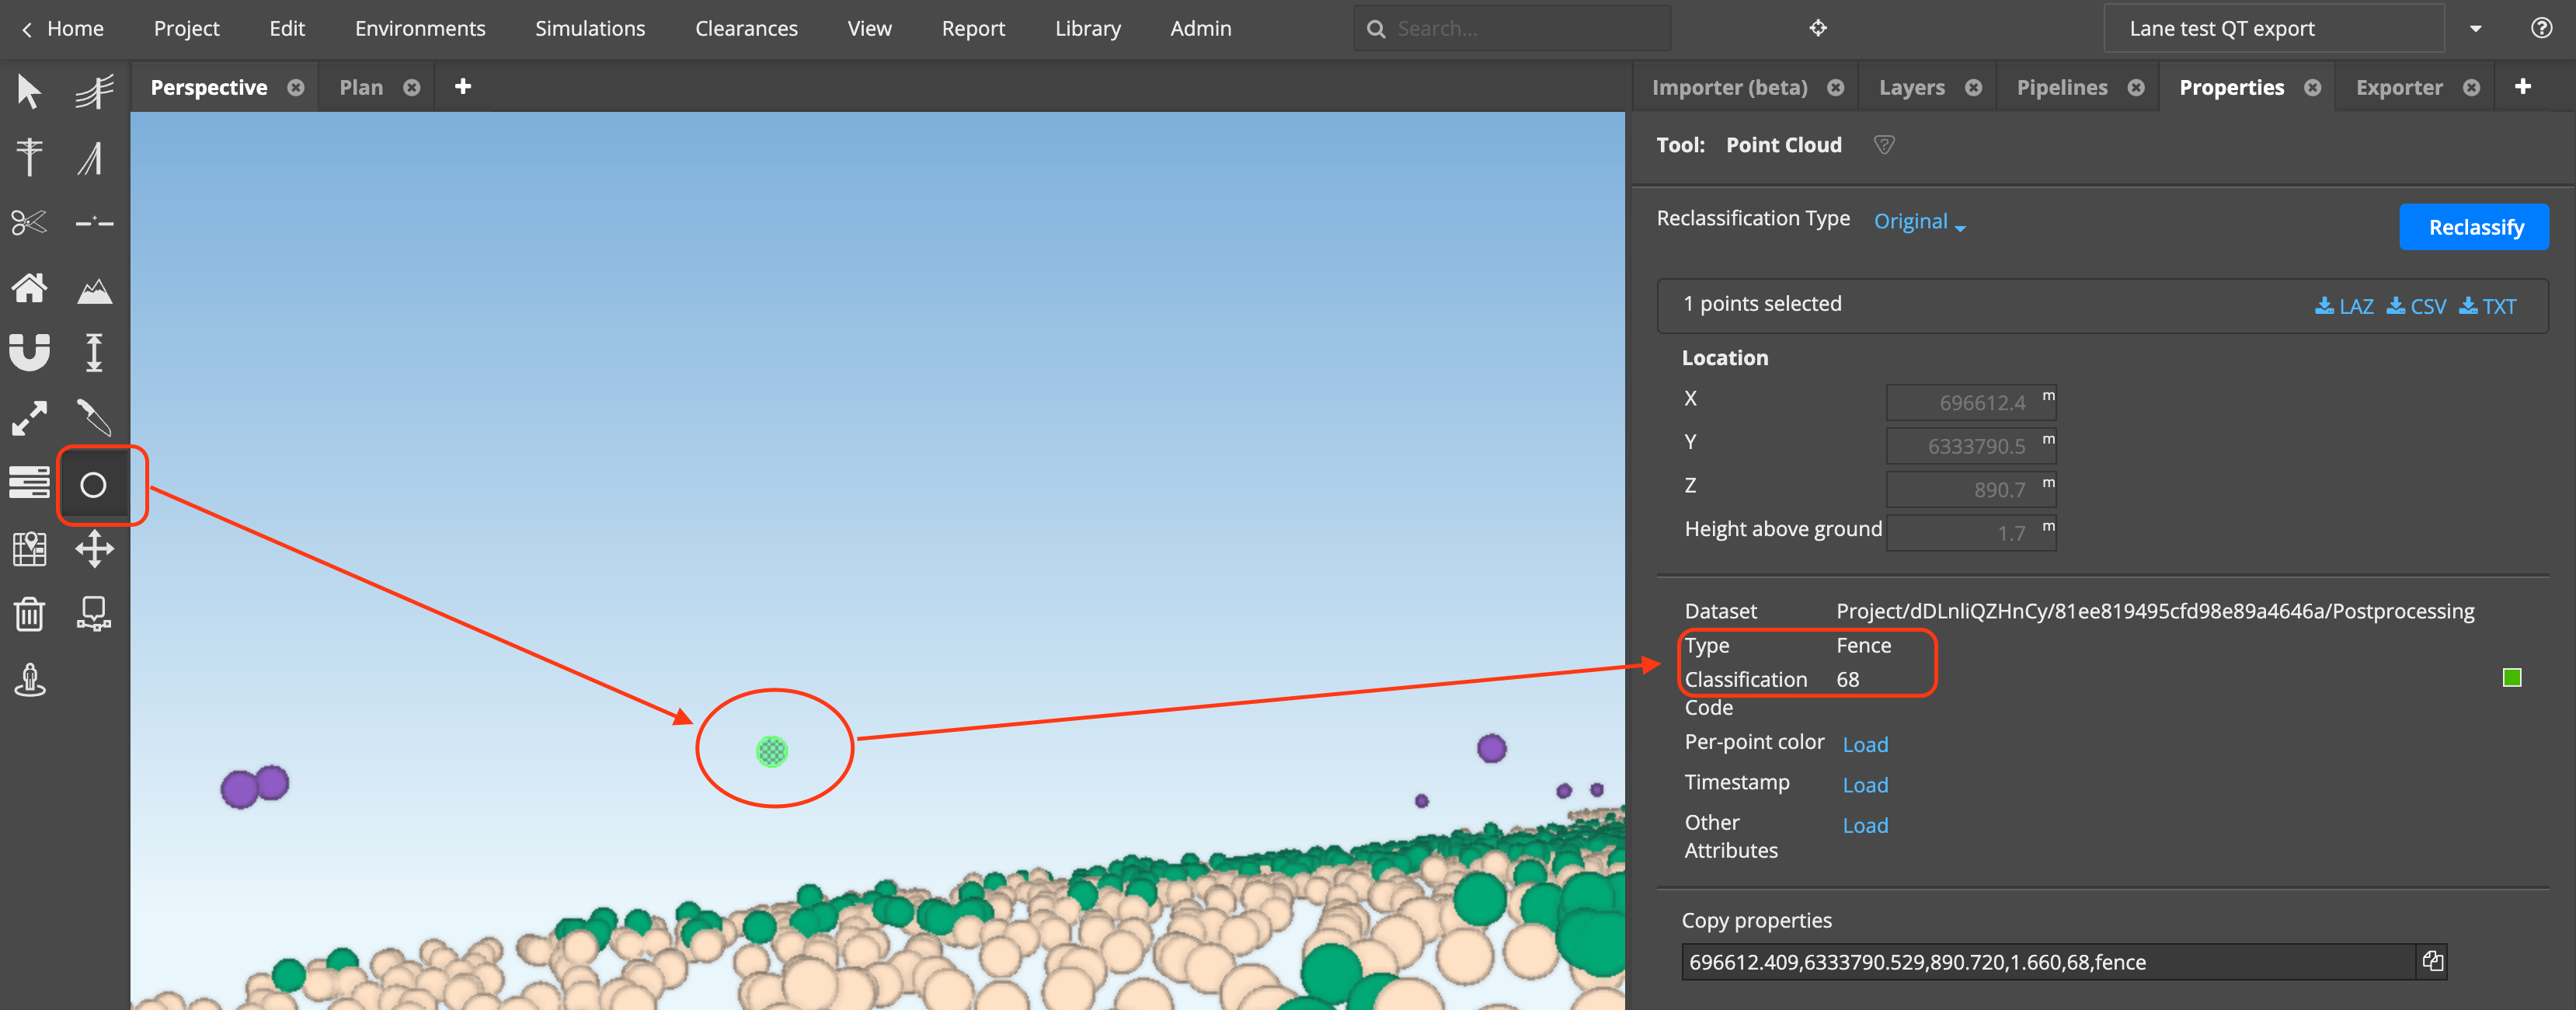
In this example they have already been classified and and color coded as Fence. To inspect a point's properties, choose the Point Cloud tool on the toolbar, and select a point:
Some of these points may be part of a real Fence, some may be noise.
Depending on your data, the pre- and post- processing presets can help minimise or eliminate the noise. (Note: you can follow the steps below with unclassified LiDAR data too).
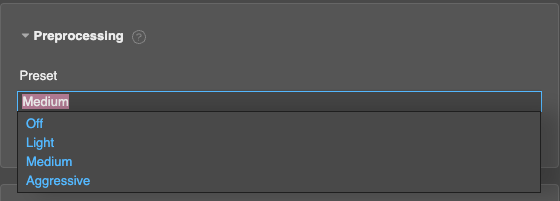
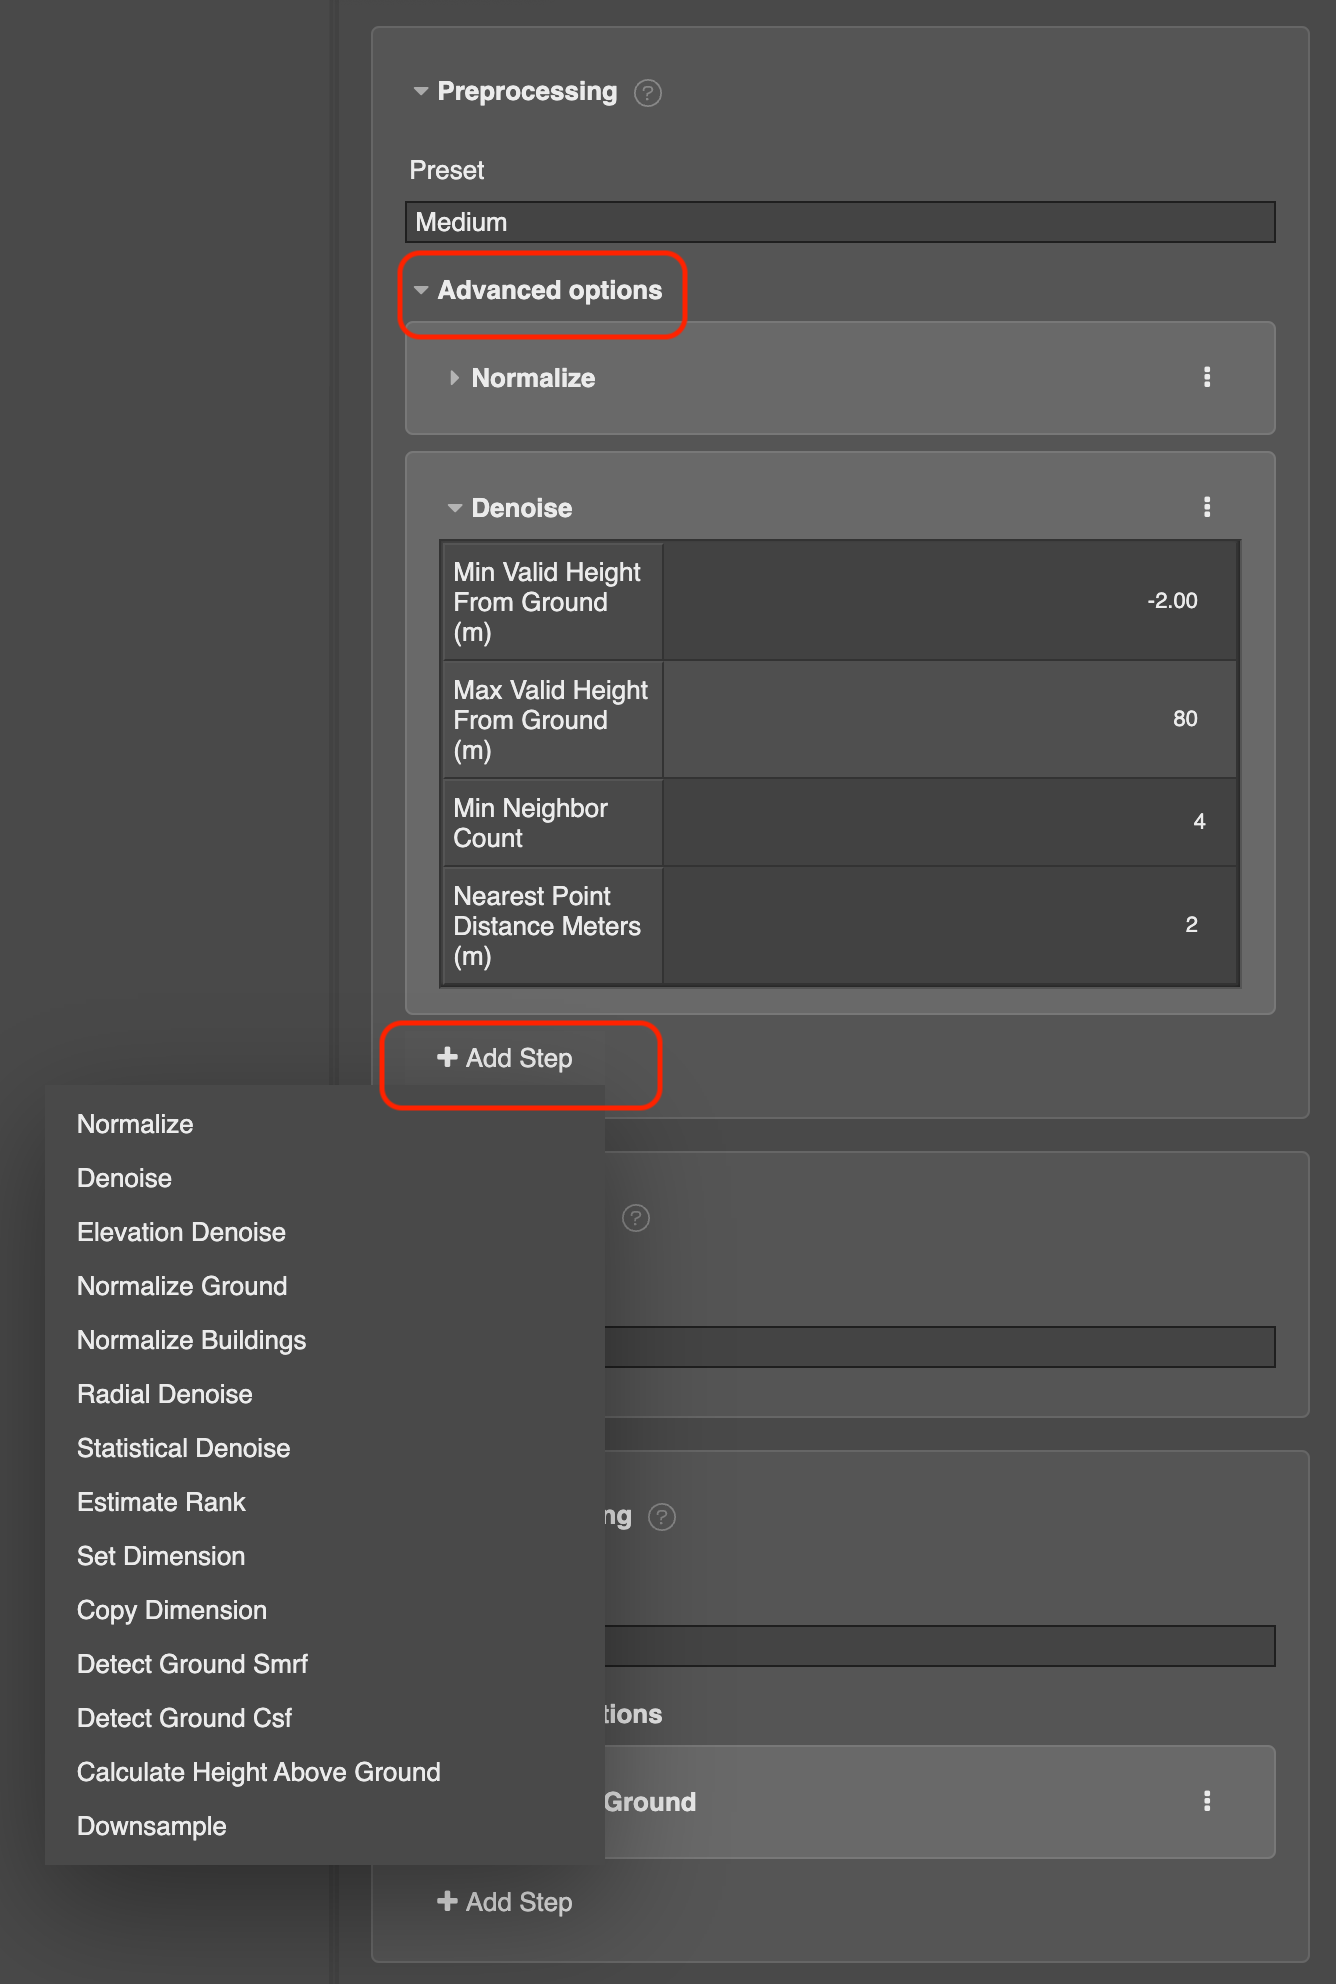
To see the effect of the Presets, expand the Advanced options section, and then expand the Denoise step, in a stage in the Pipeline, and then select a different preset. You'll notice that the denoise parameters values will change:

In our example with the Medium preset, we're interested in these two parameters:
- Min Neighbour Count
- Nearest Point Distance
How it works
In this example a point will be classified as noise unless there at least 4 neighboring points within a Nearest Point Distance of 2 meters
You can use the Clearance Measure tool on the toolbar to see how the outlying points in the LiDAR compare to this preset.
Choose the tool, and then click on one of the outlying points, and then hover over a nearby point to see the distance between the two. If you don't see the Clearance Measure tool, click the More icon (…) at the bottom of the toolbar to turn it on:
Notice in the video that there aren't at least 4 neighbouring points within 2m of the selected point. In this case, this preset will result in that point being classified as Noise.
If we select the Aggressive preset, notice that the denoise parameters change:
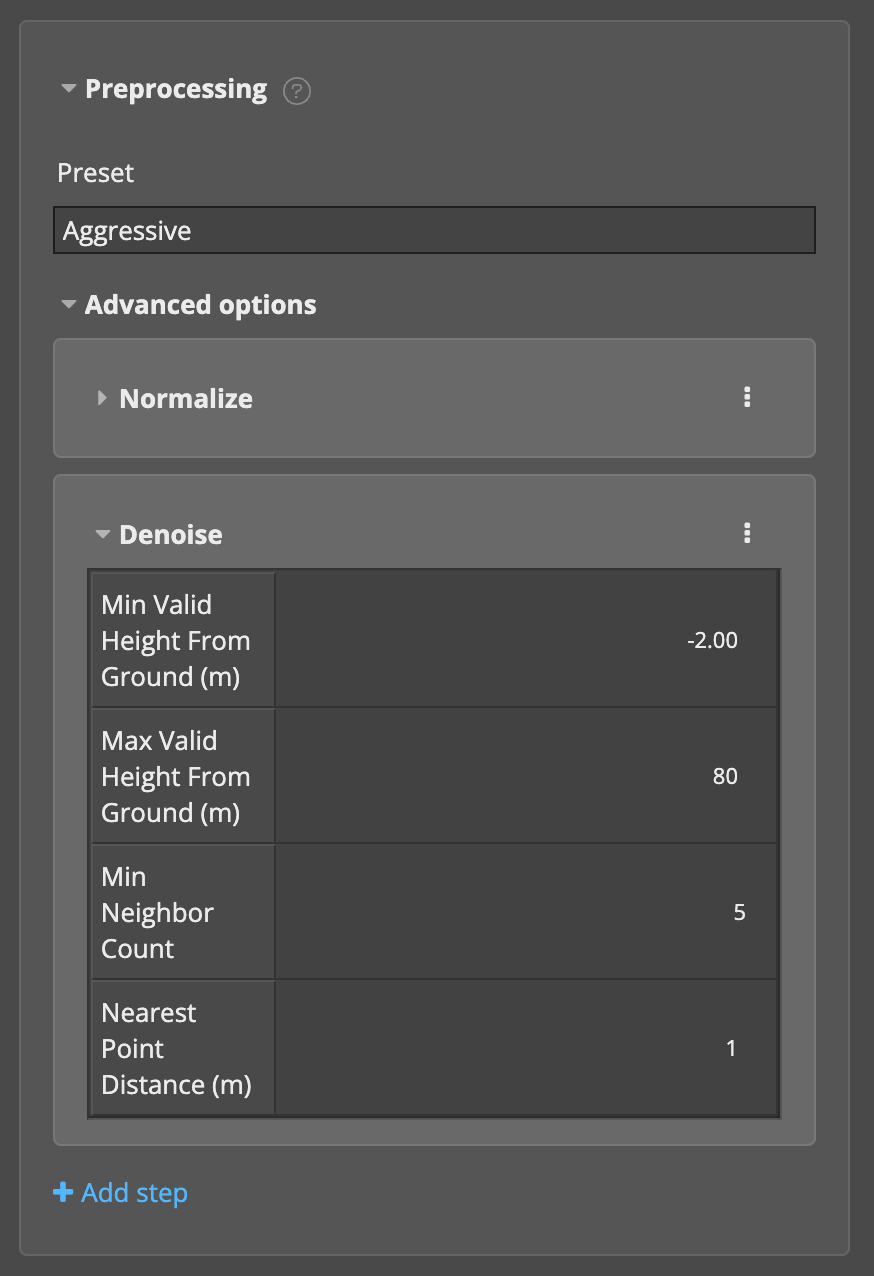
With this preset a point will be classified as Noise unless there at least 5 neighboring points within 1 meter. In the example above and based on the measured distances, the selected point would still be classified as Noise. However this preset might now result in incorrect denoising in other parts of the data.
To demonstrate, we'll zoom into a part of the LiDAR that appears to be a valid fence-like structure, and measure the distances again:
Notice that the selected point has 5 neighboring points, but only some of them are within 1 meter away. In this case, these will be classified as Noise - so this preset will filter out potentially useful, non-noise data points.
In practice, the values you set will depend on your source LiDAR data. We recommend that you start with a lighter default preset and then tune the parameters by inspecting parts of data .
Advanced options
For granular control, expand the Advanced options inside one of these stages to modify the default processing steps, or add additional processing steps:
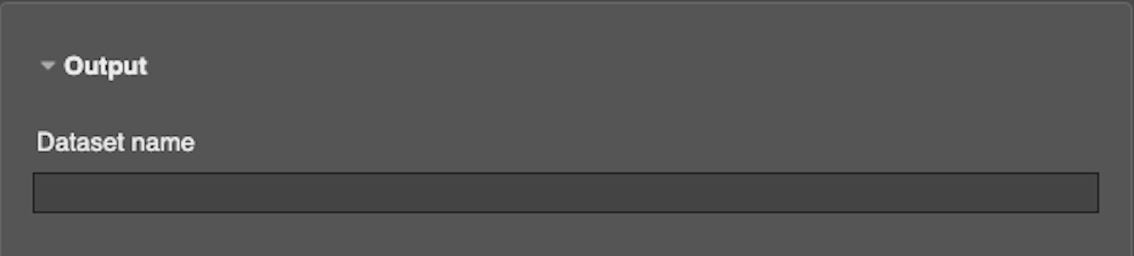
Output
In the Output stage, set the name of the output dataset that will be produced post-classification:
Previewing the output before running the pipeline
Neara offers a fast and easy way to preview the classification and effects of different pre- and post- processing options before processing your entire dataset.
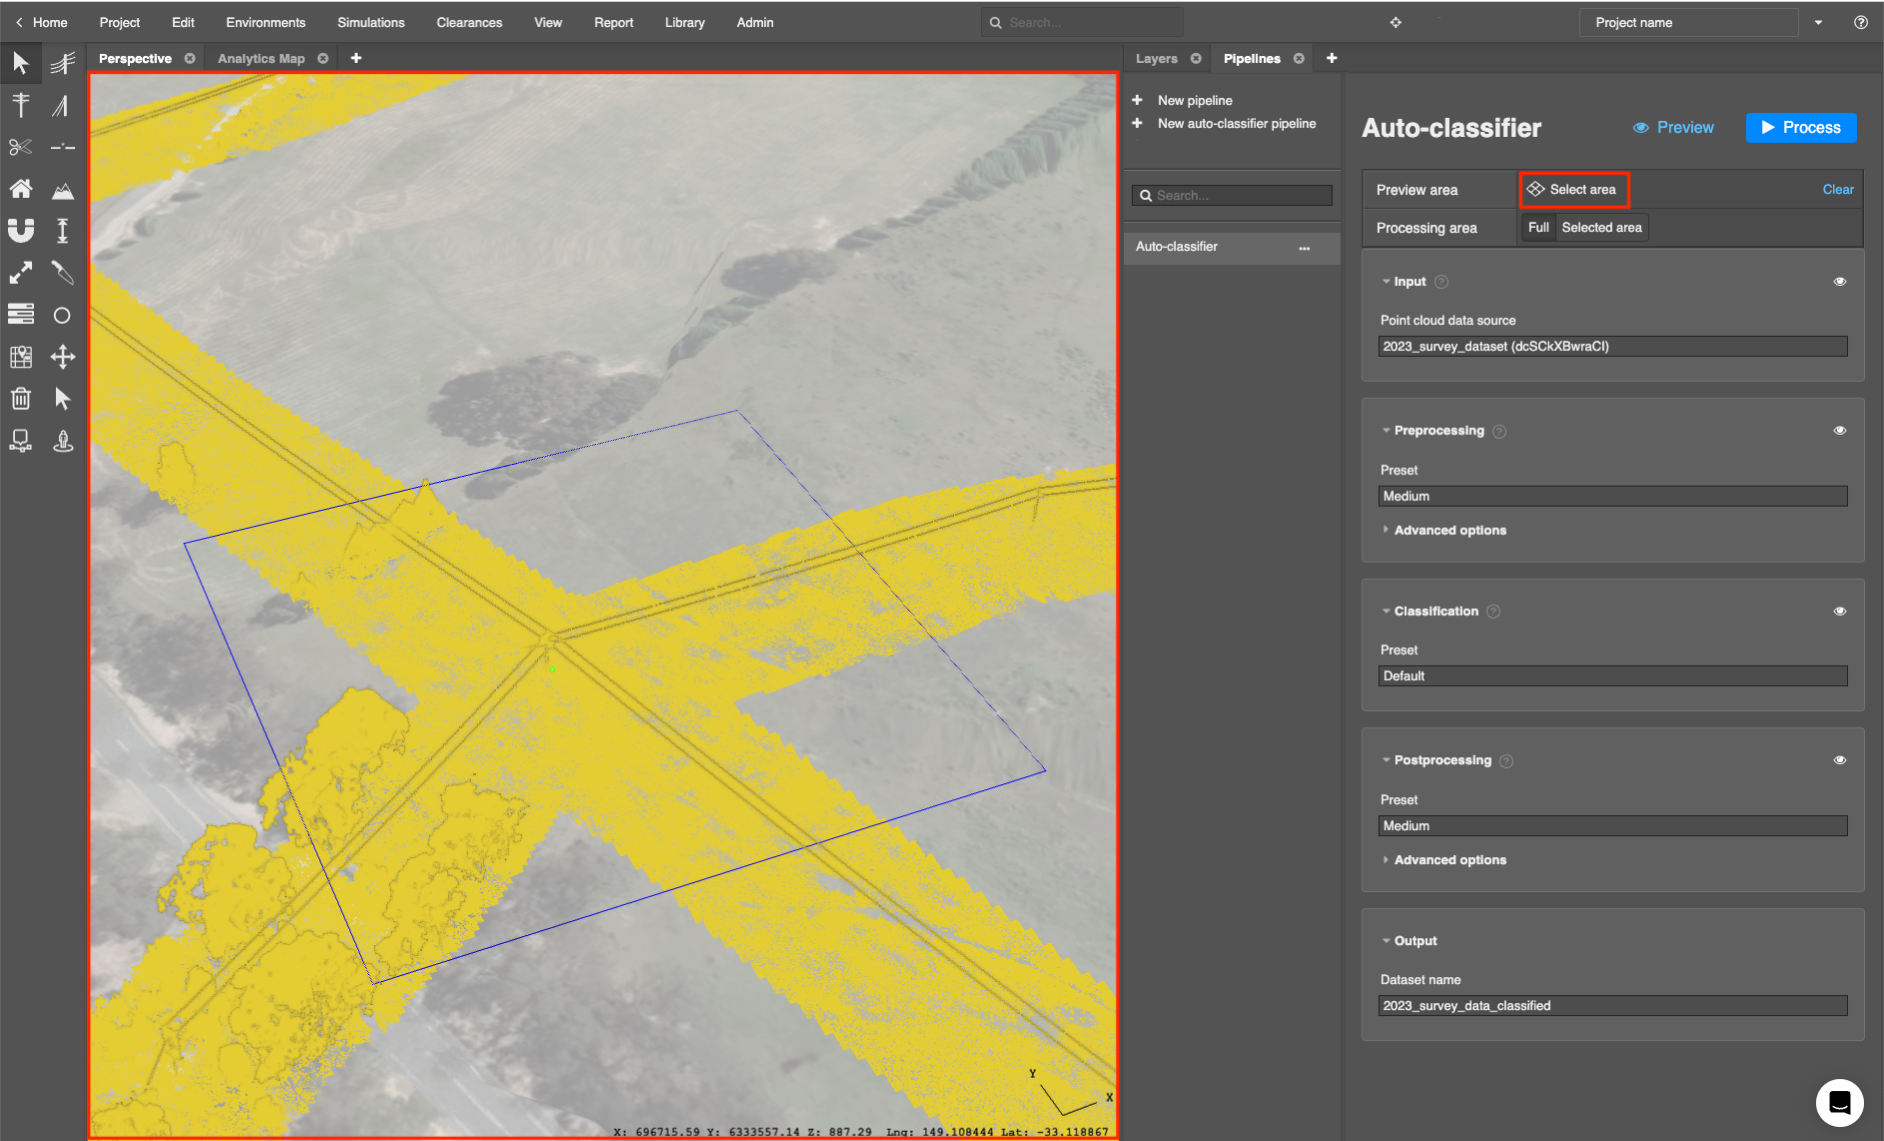
First, make sure that your pipeline has a Point cloud data source input, and an output Dataset name.
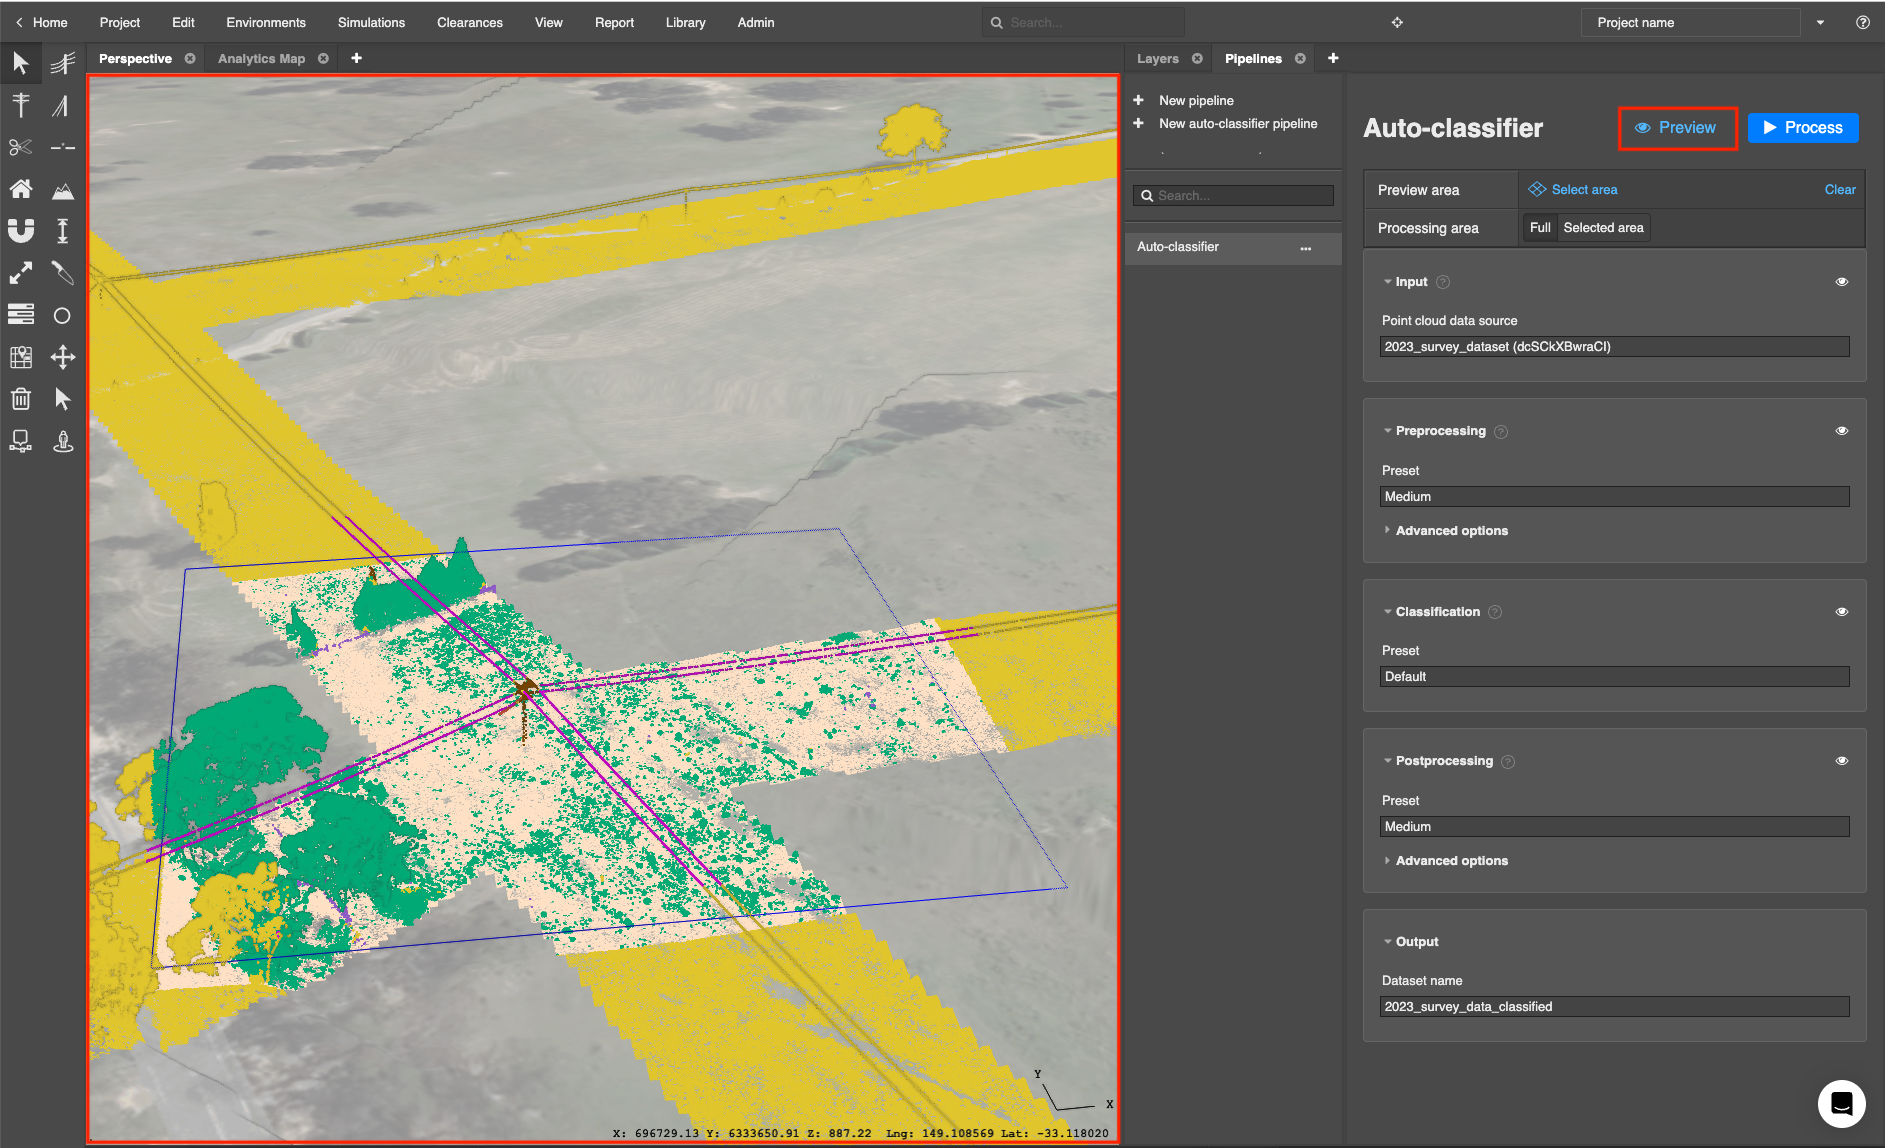
Select a limited area to preview by clicking the Select area option at the top of the Pipelines panel and then position the preview area selector outline over an area that contains LiDAR data, in the Perspective View:
Notes:
- Your area preview will disappear if the Pipelines panel is not visible or another pipeline is selected.
- If you select an area that does not contain any LiDAR data, the Preview option will be disabled.
Once selected click the Preview button. When the preview is ready the output will be updated in the Perspective View to show classified data:
You will also notice that the visibility  icon is shown for each stage of the pipeline, and for each step within those stages.
You can toggle the visualisation of each individual stage and/or step to see how they affect the classification process before you start processing the entire dataset.
Processing your pipeline
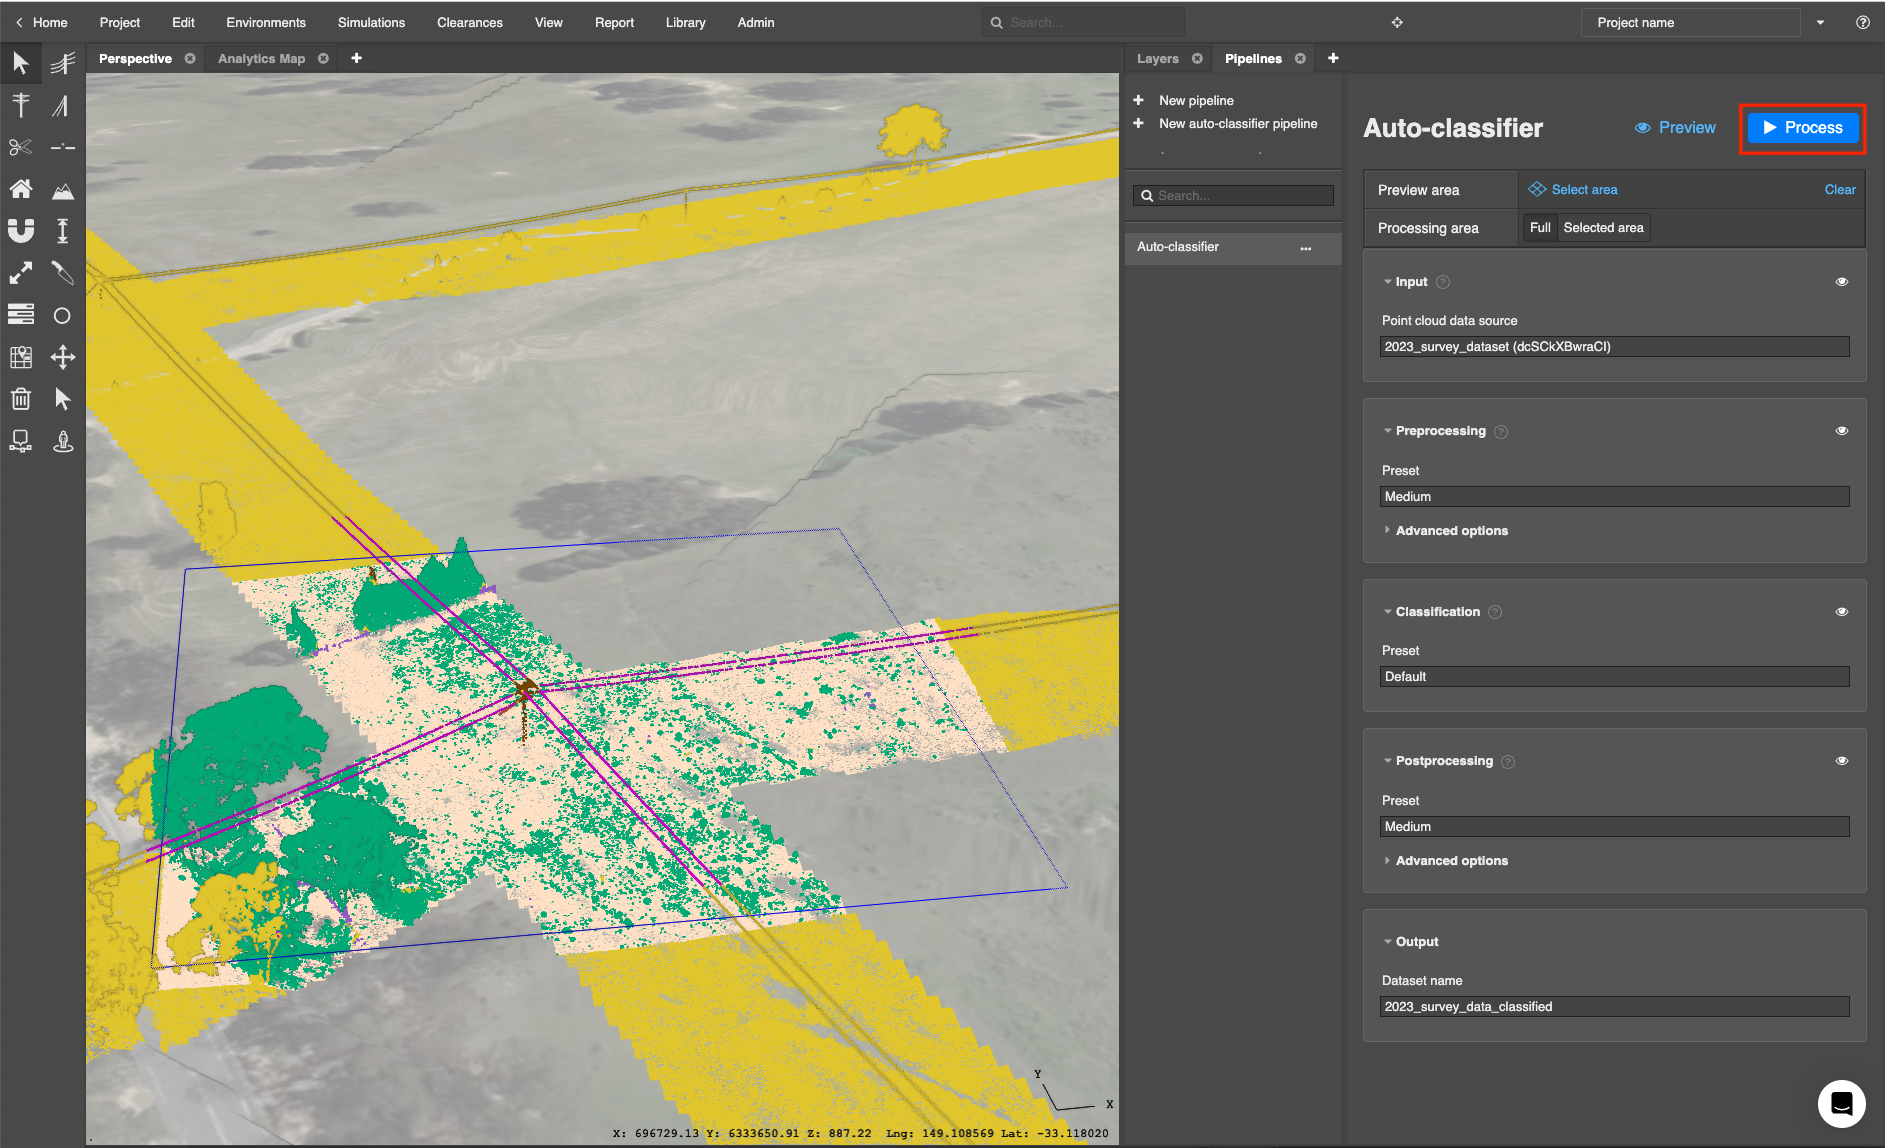
If you are satisfied with the output preview, you're ready to process the pipeline. You can classify the full LiDAR dataset, or just the selected area.
When you are ready, click Process. You will be presented with a confirmation dialog before processing commences:
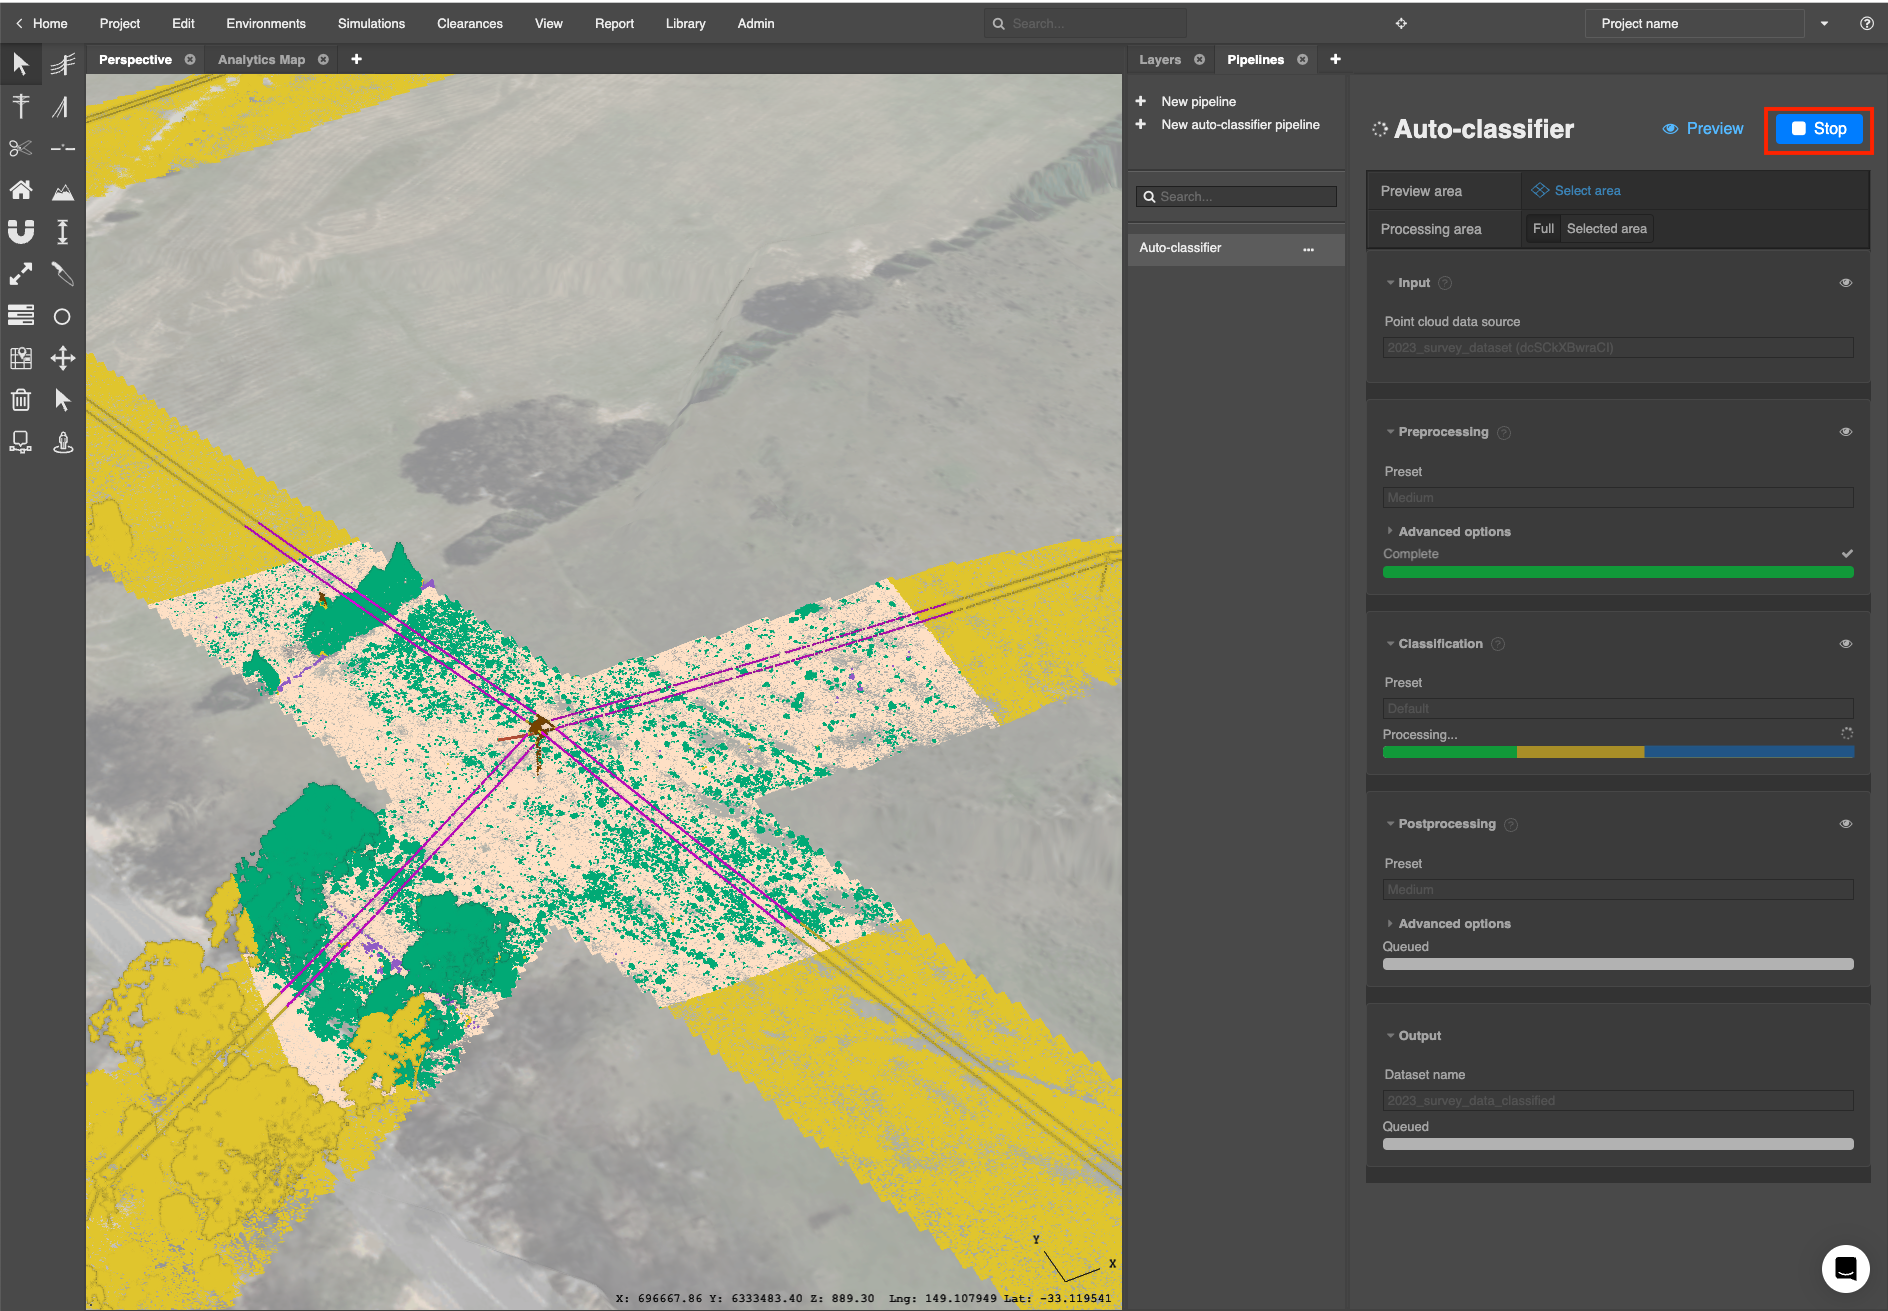
To cancel pipeline processing, click the Stop button at the top of the panel:
Understanding the pipeline status
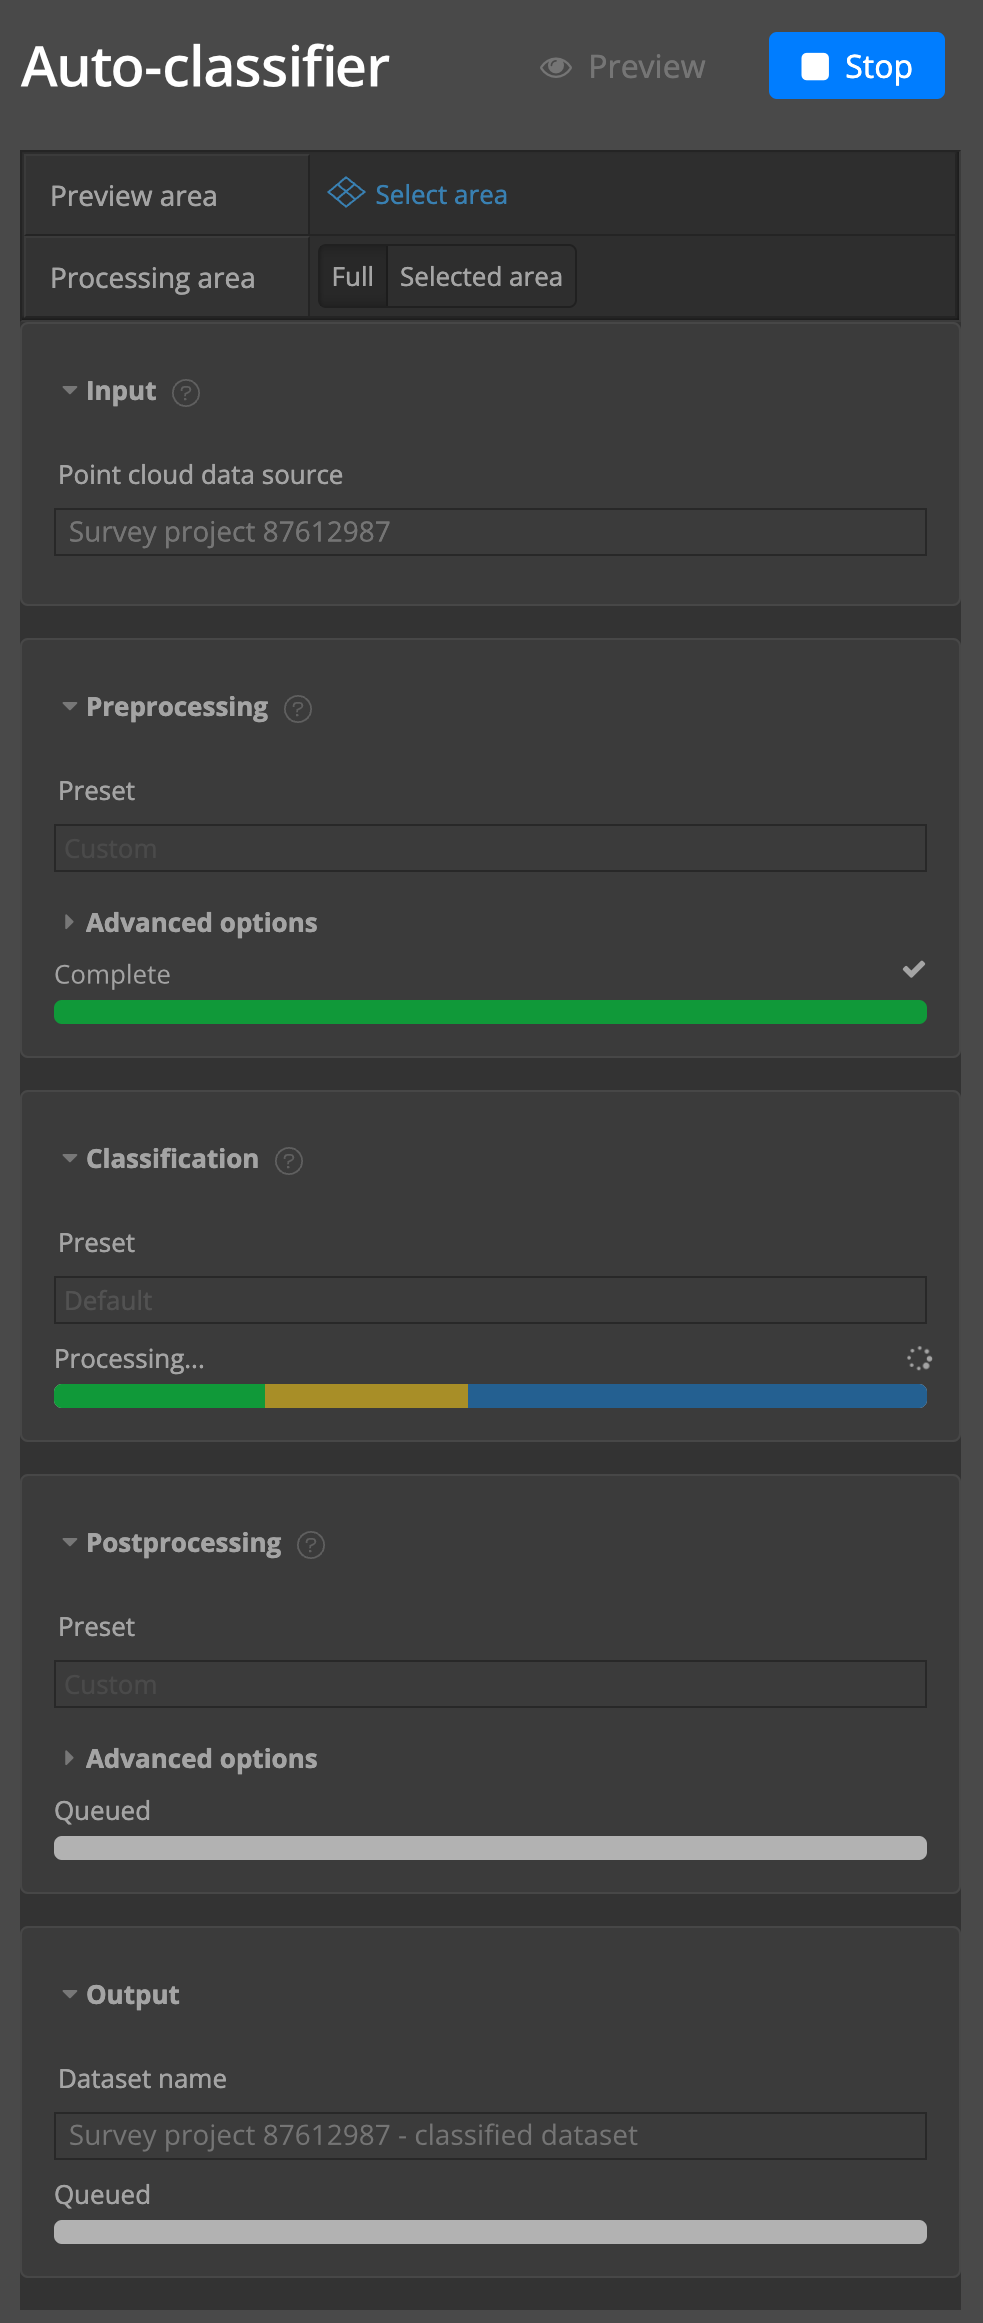
During processing, the Pipelines panel shows the status of each stage as either:
- Preparing resources
- Processing
- Complete, or
- Queued
Preparing resources
When computing resources are being prepared for a pipeline stage, but processing has not yet started, the progress bar will read Preparing resources... and will display as a grey animated bar.
This start up time may vary, and is independent of the size of your dataset.
Processing
When processing has started, the progress bar will read Processing... and the bar will be blue.
As processing continues, you will notice portions of the blue bar turn yellow and green. The yellow portion of the progress bar indicates the portion of processing currently in-flight, and the green portion of the progress bar indicates the portion of processing that has completed.
Complete
Once a stage has finished processing, the progress bar will read Complete and the bar will be green.
Queued
For future stages that are not yet ready to start, the progress bar will read Queued and will display as a grey bar:
Using your classified LiDAR data
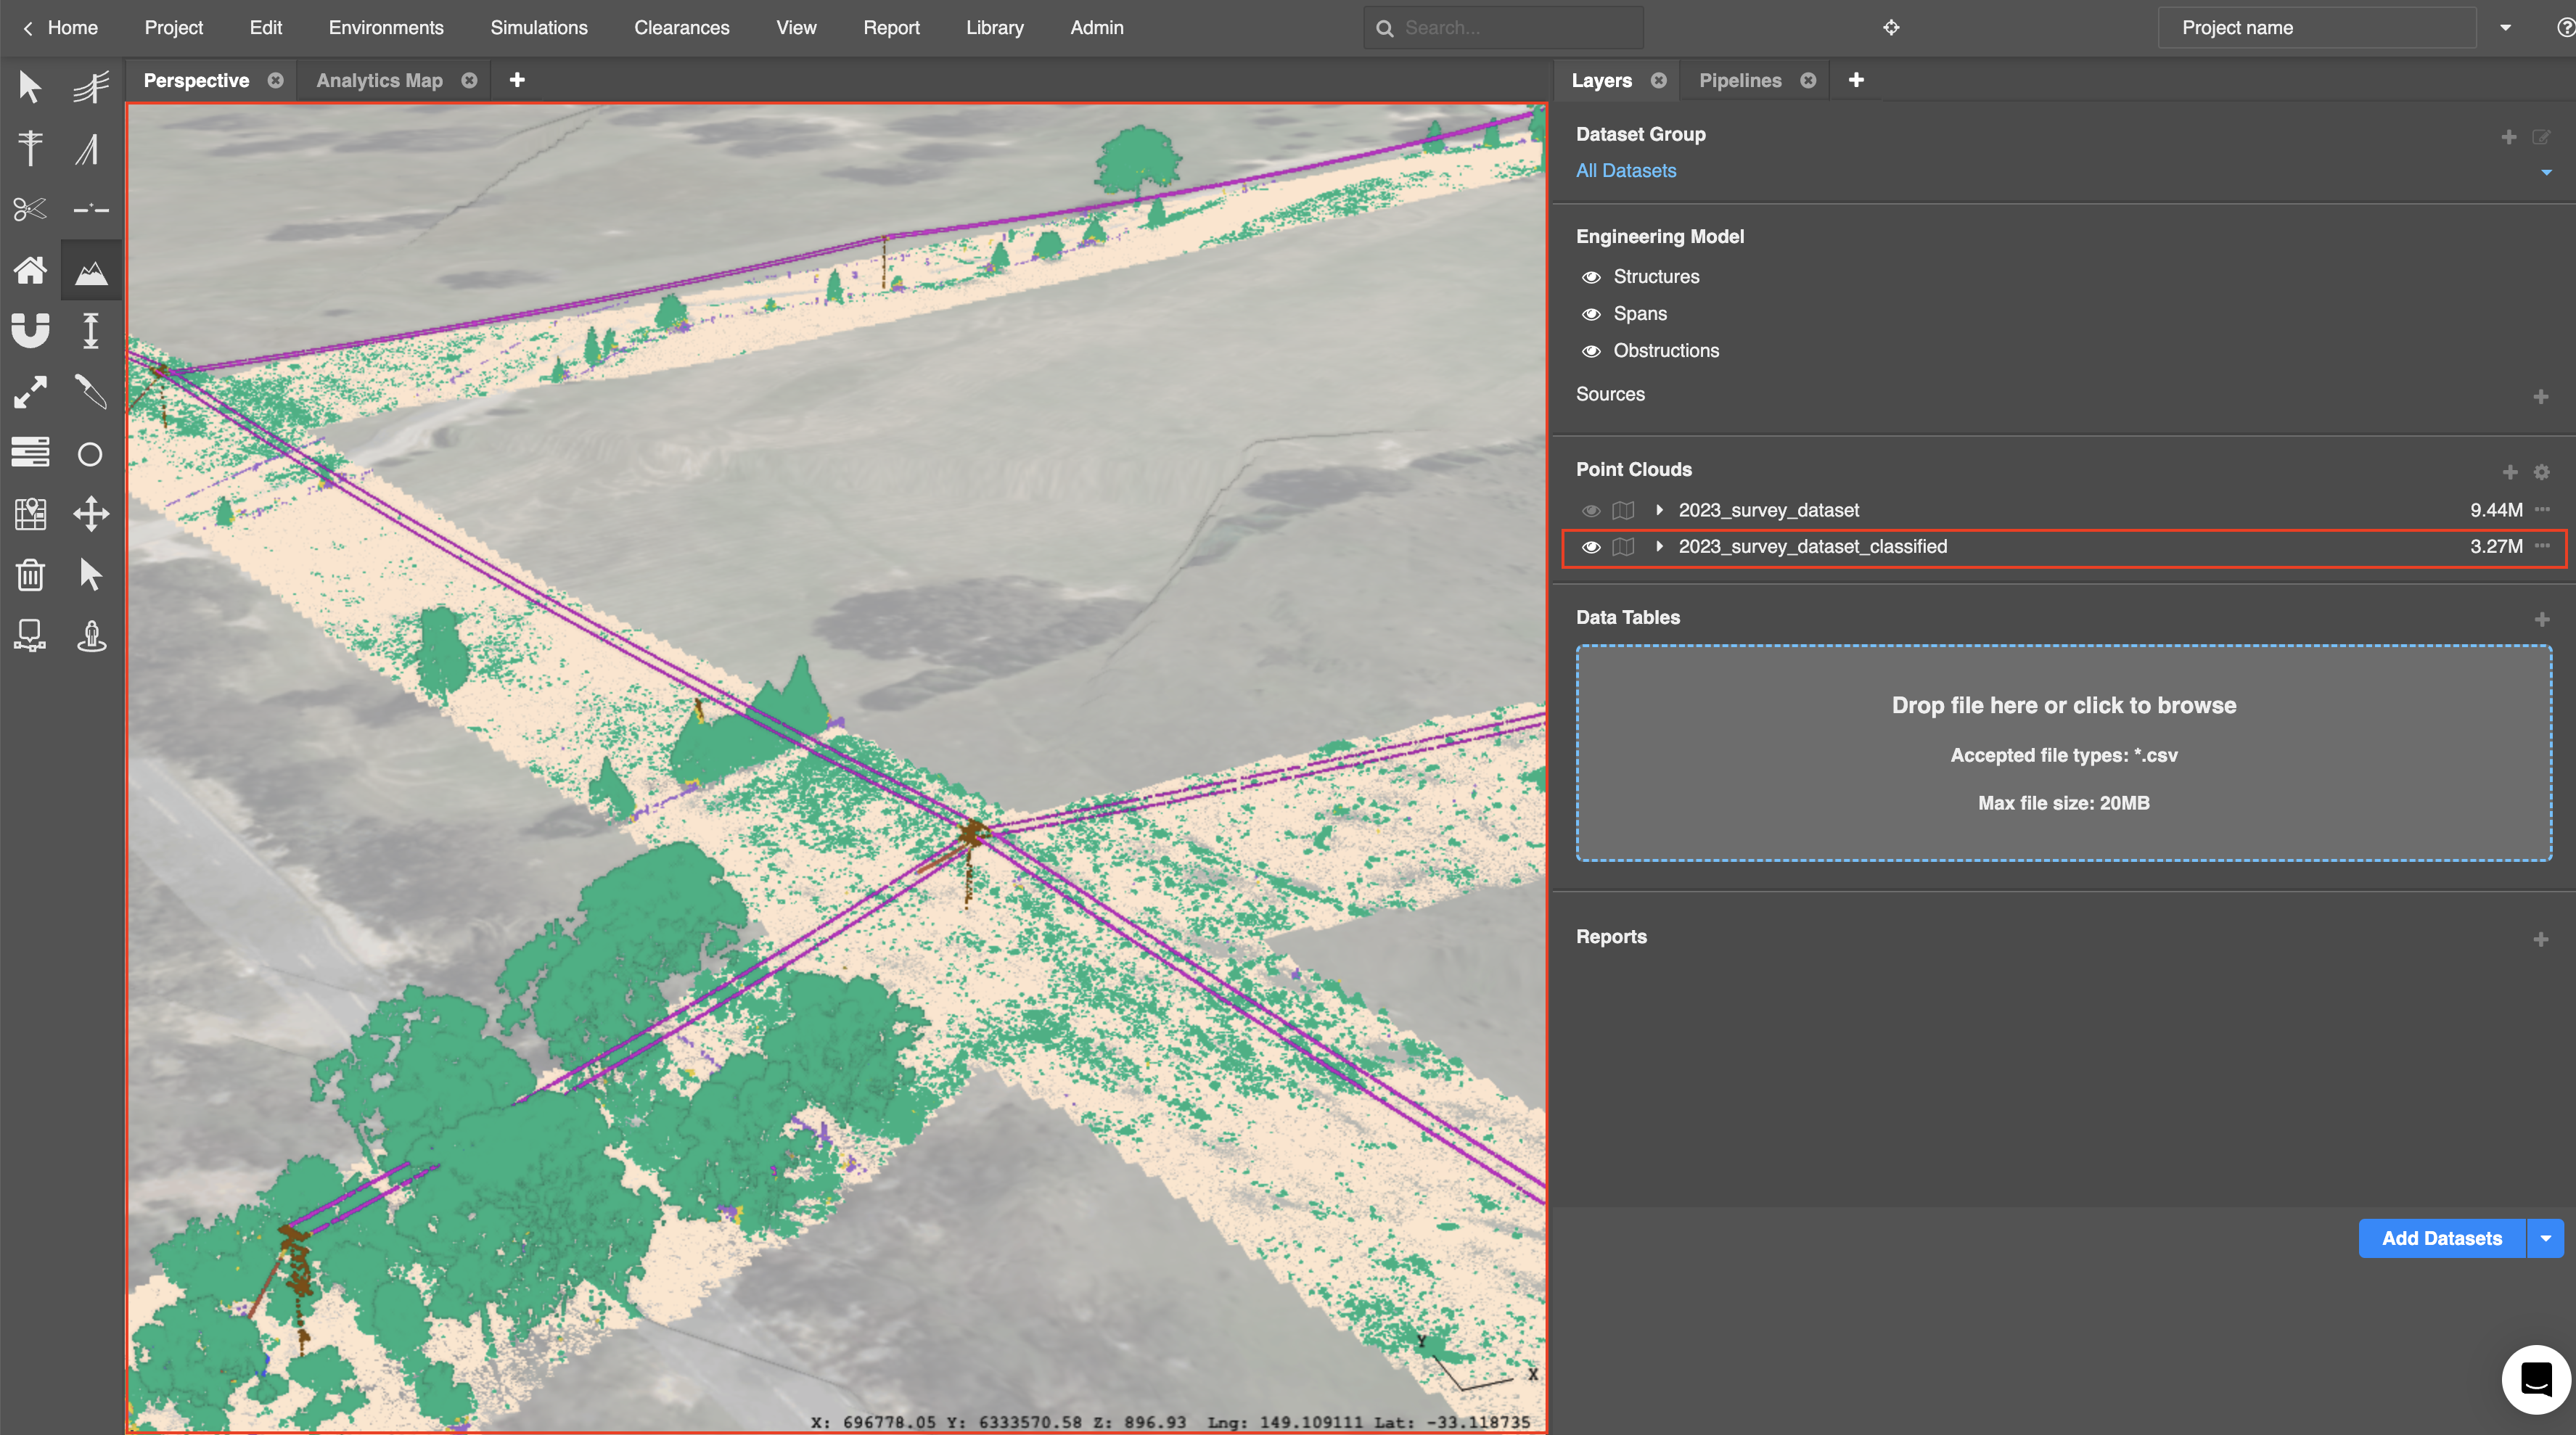
Once processed, your classified LiDAR dataset is shown in the Point Clouds section of the Layers panel.
To open the Layers panel, click the (+) button at the right hand end of the tabs in any section of the workspace and select Layers under the Tools section in the popup.
Click the visibility icon next to the dataset name in the Layers panel to toggle the visualisation of the dataset in the Perspective View: