Working with tables in Reports
Learn how to use tables in reports to organize and present data

Written by Lane Cipriani
Updated at September 4th, 2023
Table of Contents
Tables are the default format for viewing data in Neara Reports, and provide customisable detail:
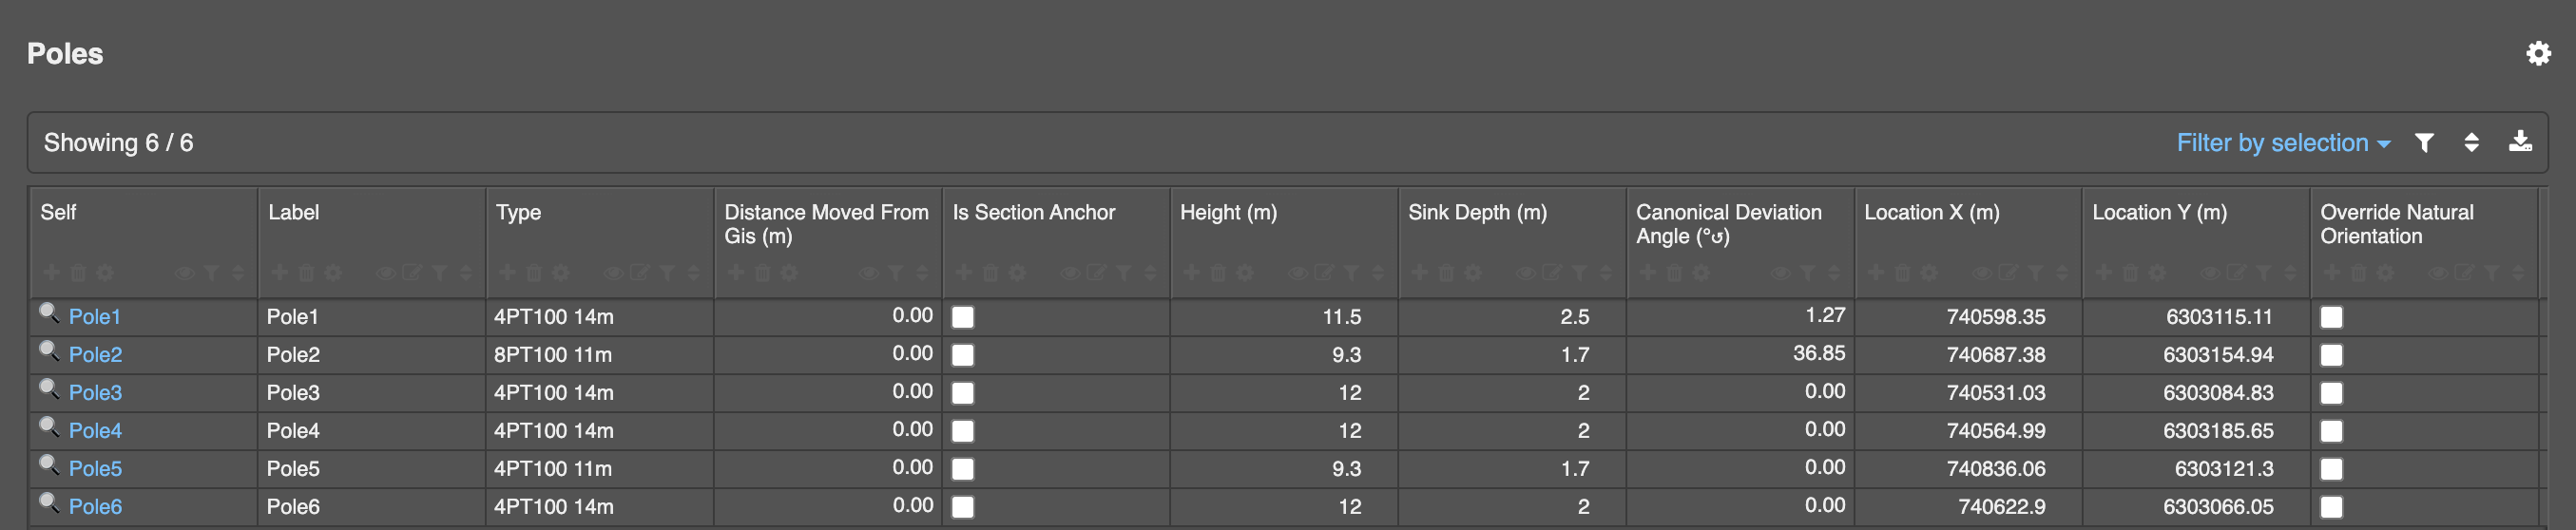
In this format the table columns are configurable, sortable, filterable, and can be rearranged and renamed.
The cells of the table can contain a variety of content including:
- Text and numbers
- Formulas
- Hyperlinks - to navigate directly to items in your network and more
- Controls - like checkboxes that represent on/off or yes/no, or color pickers that modify how a Report's data is visualized in the Perspective and other views
- Icons
- Progress bars - for example, a report might includes rows with cells that display updates from other reports or activities
You can modify columns to display a value if they are empty, populate columns based on specific data fields, and export data in a variety of formats including CSV, Excel, GeoJSON, Shapefile, 2D KML, and DXF.
Configuring columns
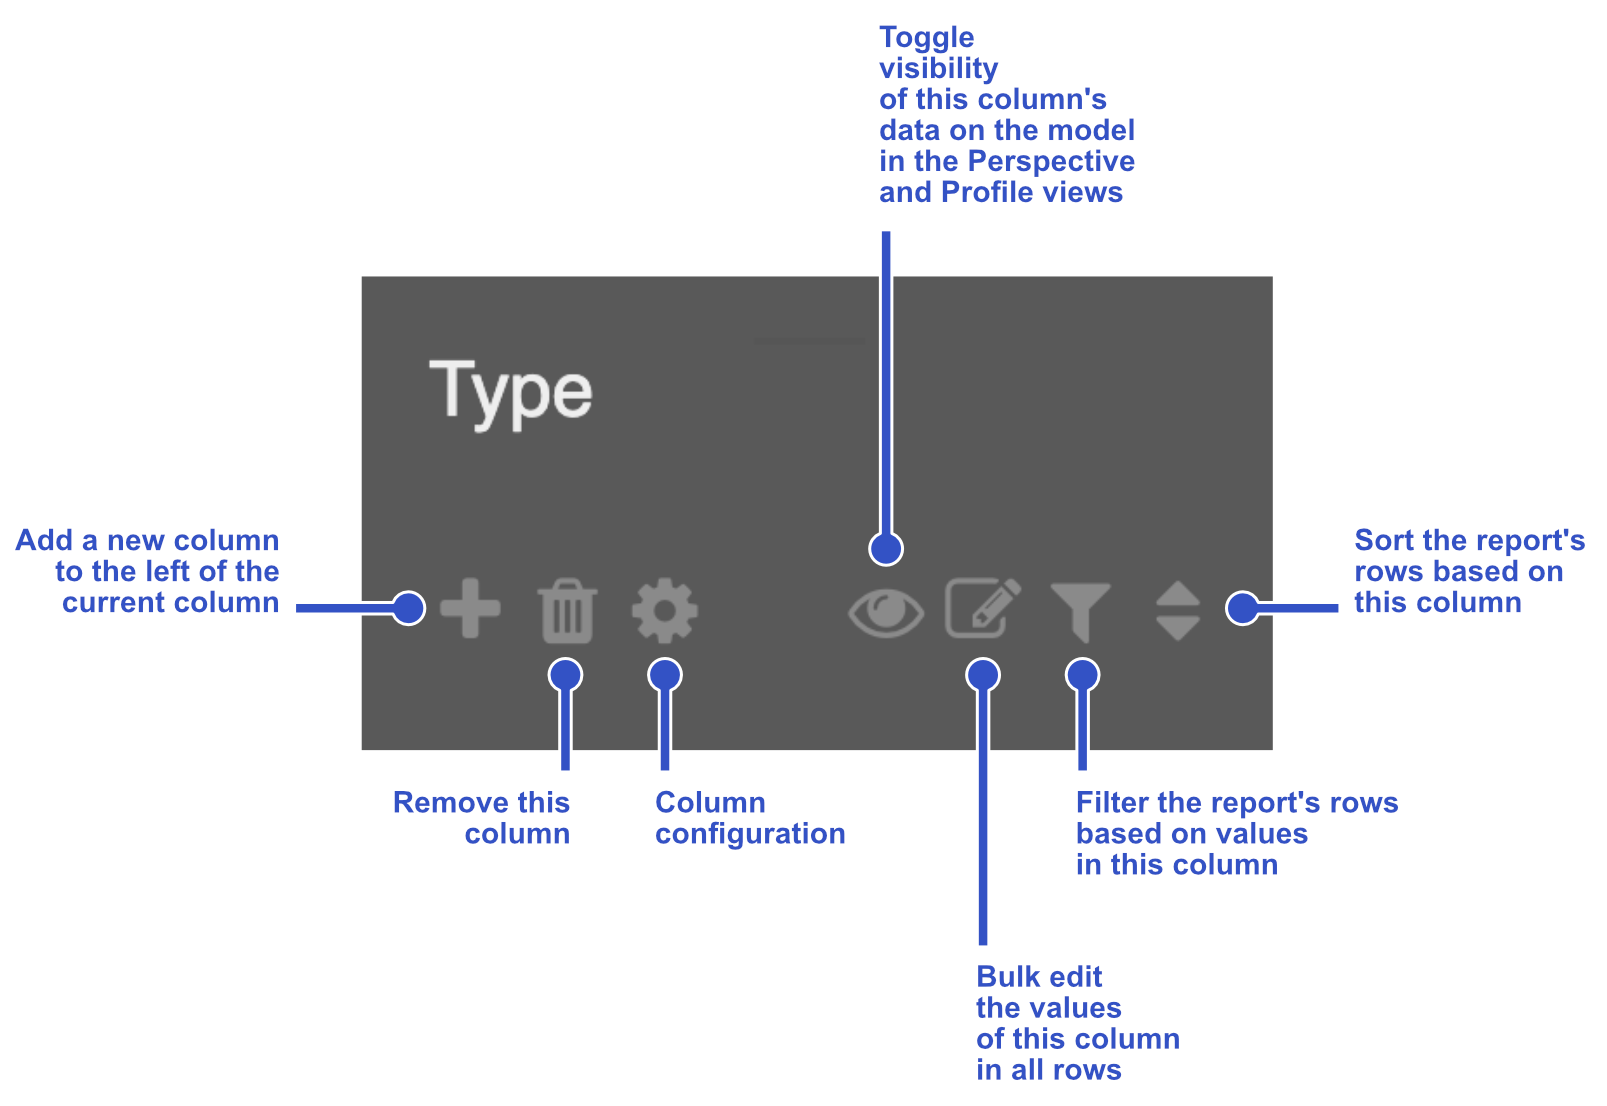
Hover your mouse over a column's header to reveal the column's controls and settings:
Column width
To make a column narrower or wider, click and drag the right-hand vertical edge of the column header:
Move a column
To move a column, click and drag the Move indicator at the top of a column's header:
Add a column
Click the + icon to insert a new column to the left of the current column.
Using the example of a stay report add a column to show the Status of the pole it is attached to. In the popup, click the Field box and choose Pole and then in the sub-Field box choose Status. Give the column a name in the Title box.
The column's configuration will save automatically as you modify its settings. To dismiss the popup, click anywhere outside of it:
Remove a column
To remove a column from a report, hover over the column's header and click the Trashcan icon:
Modify a column's configuration
To view and modify a column's configuration (which controls the data displayed in that column) click the Gear icon in the column header.
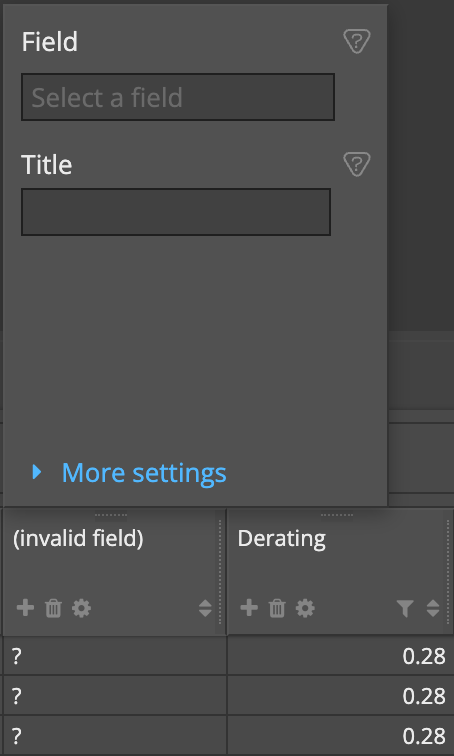
If you inspect the configuration for a new, blank column it will show a popup with an empty configuration, ready for setting up:
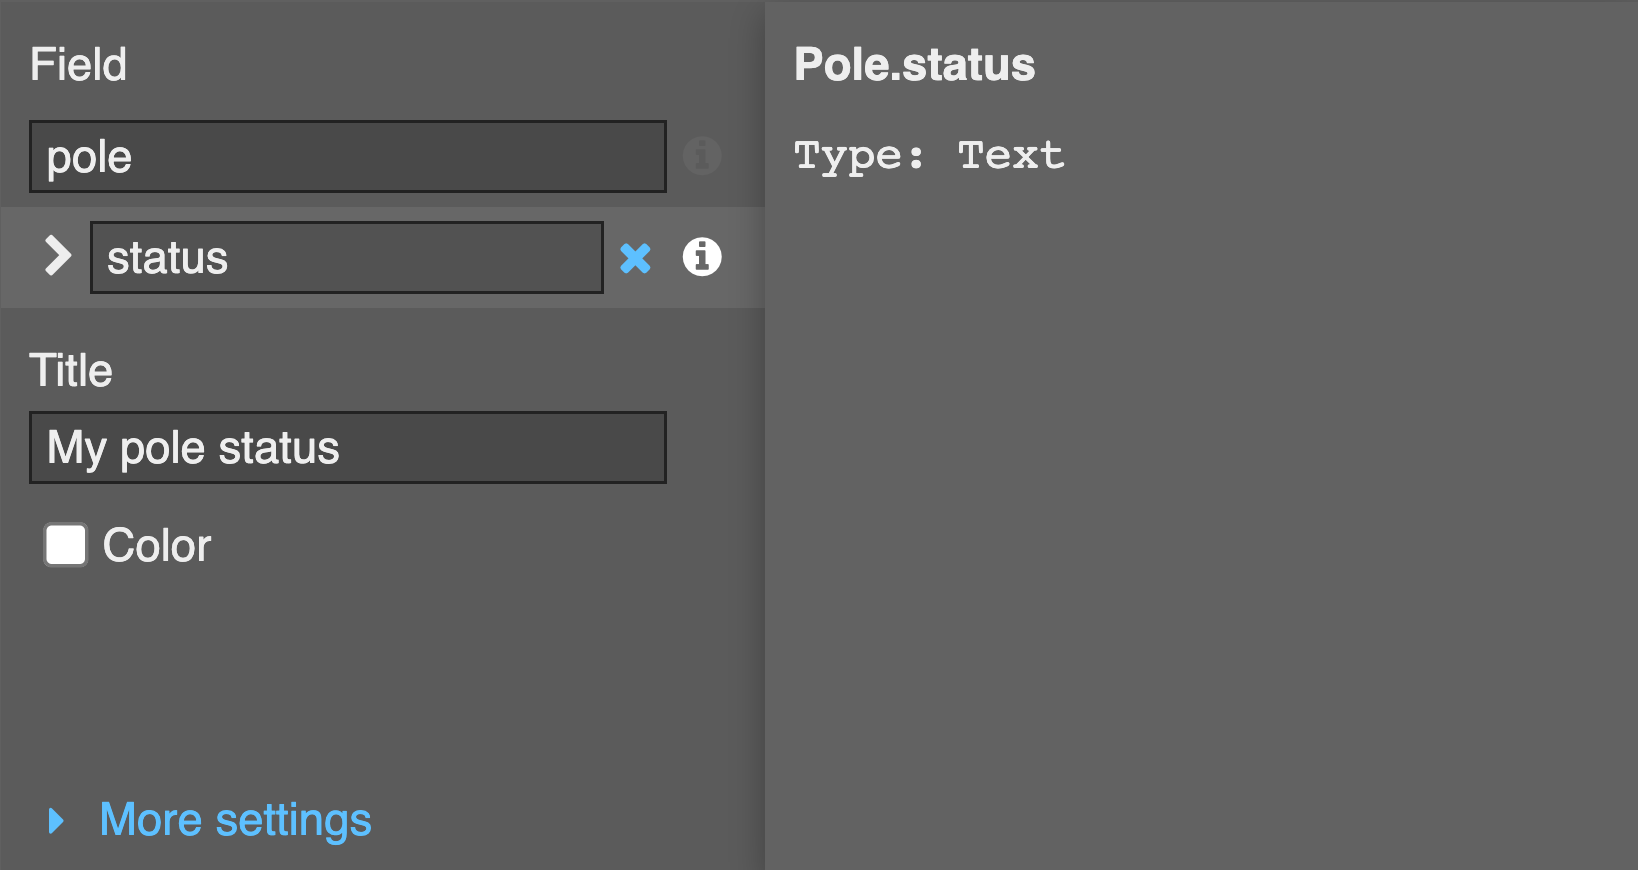
If the column has already been setup, it will display the existing configuration which can look different depending on how the column has been configured.
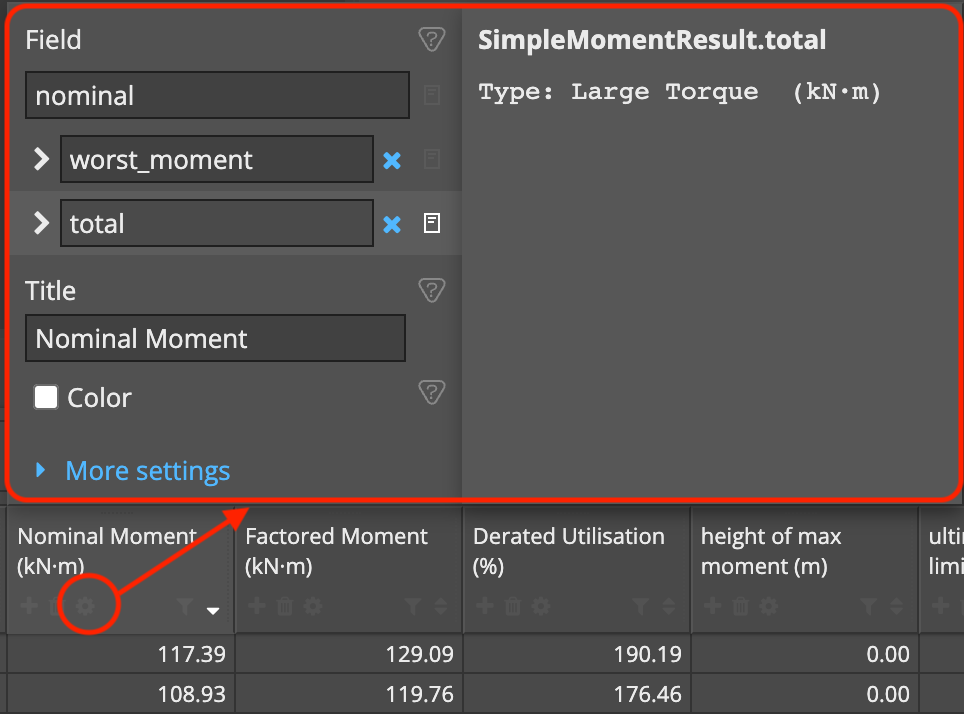
For example, a column that displays the value of an existing data field:
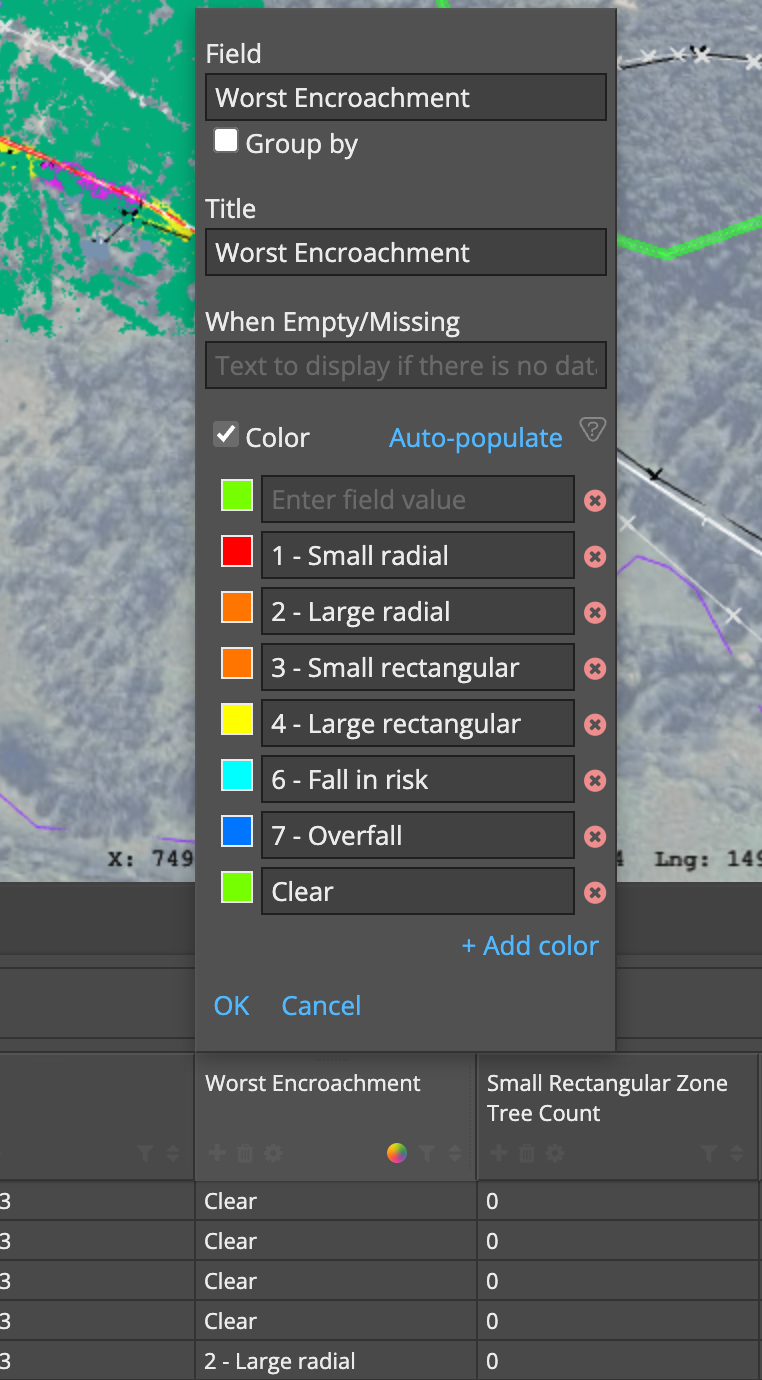
Or a column that color-codes data in the Perspective View based on its values in the Report:
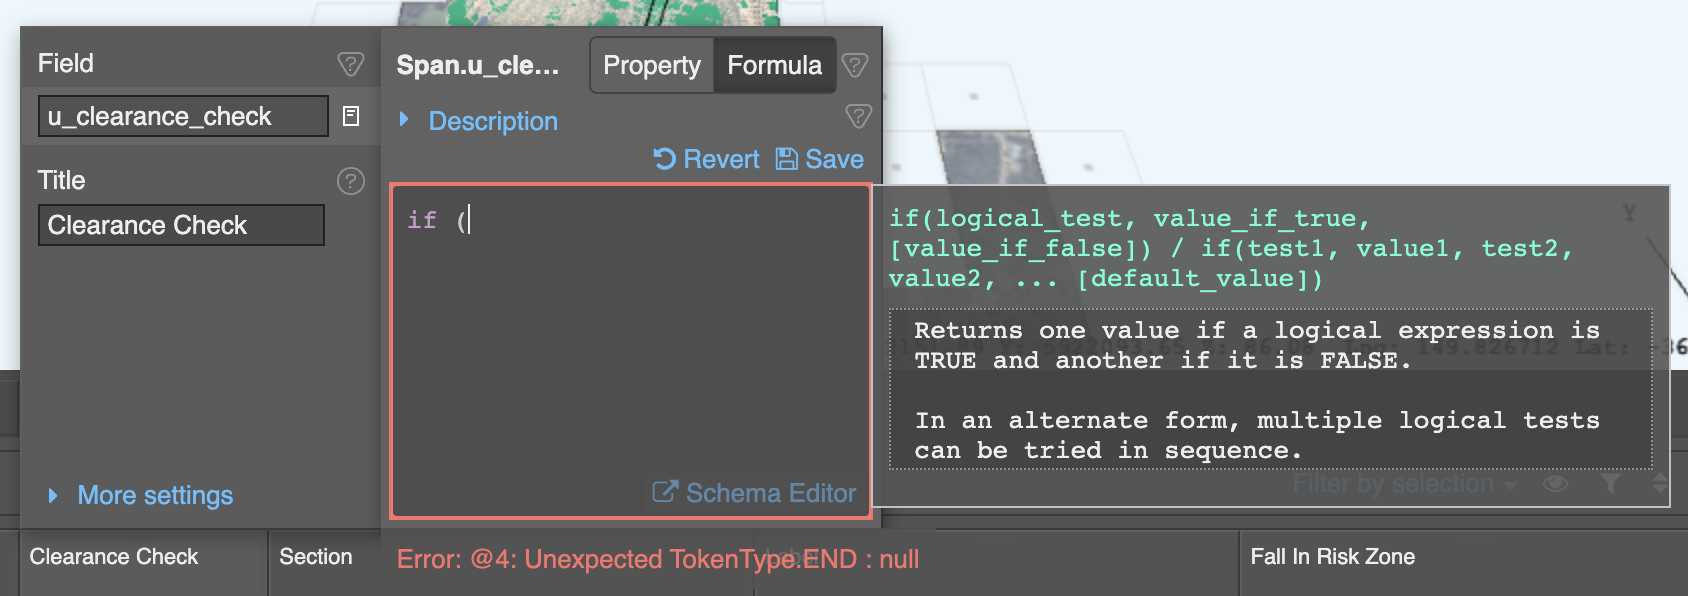
Or a column that populates data in its cells from a custom formula:
Explore more:
Bulk edit data
You can bulk update values in all rows for a specific column by clicking the edit/pencil icon
If you make a mistake, you can undo a recent bulk change by pressing CTRL+Z (Windows) or COMMAND+Z (macOS) on your keyboard.
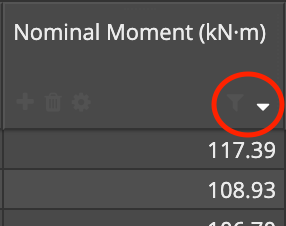
Filtering data
You can filter a report's rows by the values displayed one or more columns by clicking the filter icon in column headers.
For example setting a filter to only shows rows where a column contains a pass or fail, or a value above or below a certain number:
If you set filters on multiple columns, they operate as logical “AND” conditions - i.e. if you have filters set on both column X and column Y, the report will show only rows that contain data that matches the filter for column X AND data that matches the filter for column Y.
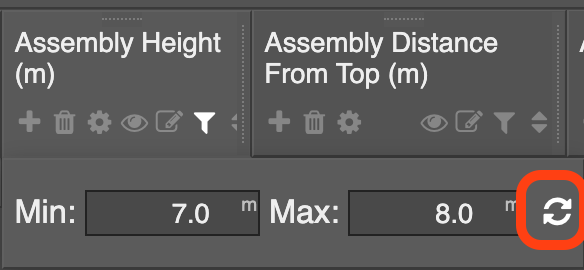
To remove a filter on a column, click the filter icon on that column's header, and in the popup click the Reset icon:
Sorting data
To sort a report based on a column's values, click the sort icon in that column's header. Click to toggle between sorting by that column's values in ascending and descending order:
Export report data
You can export data from Report tables in a variety formats.
See: Export data from a Report